Measure Topology Performance
After you start the jobs included in a topology, you can measure the health and performance of all jobs and systems in the topology.
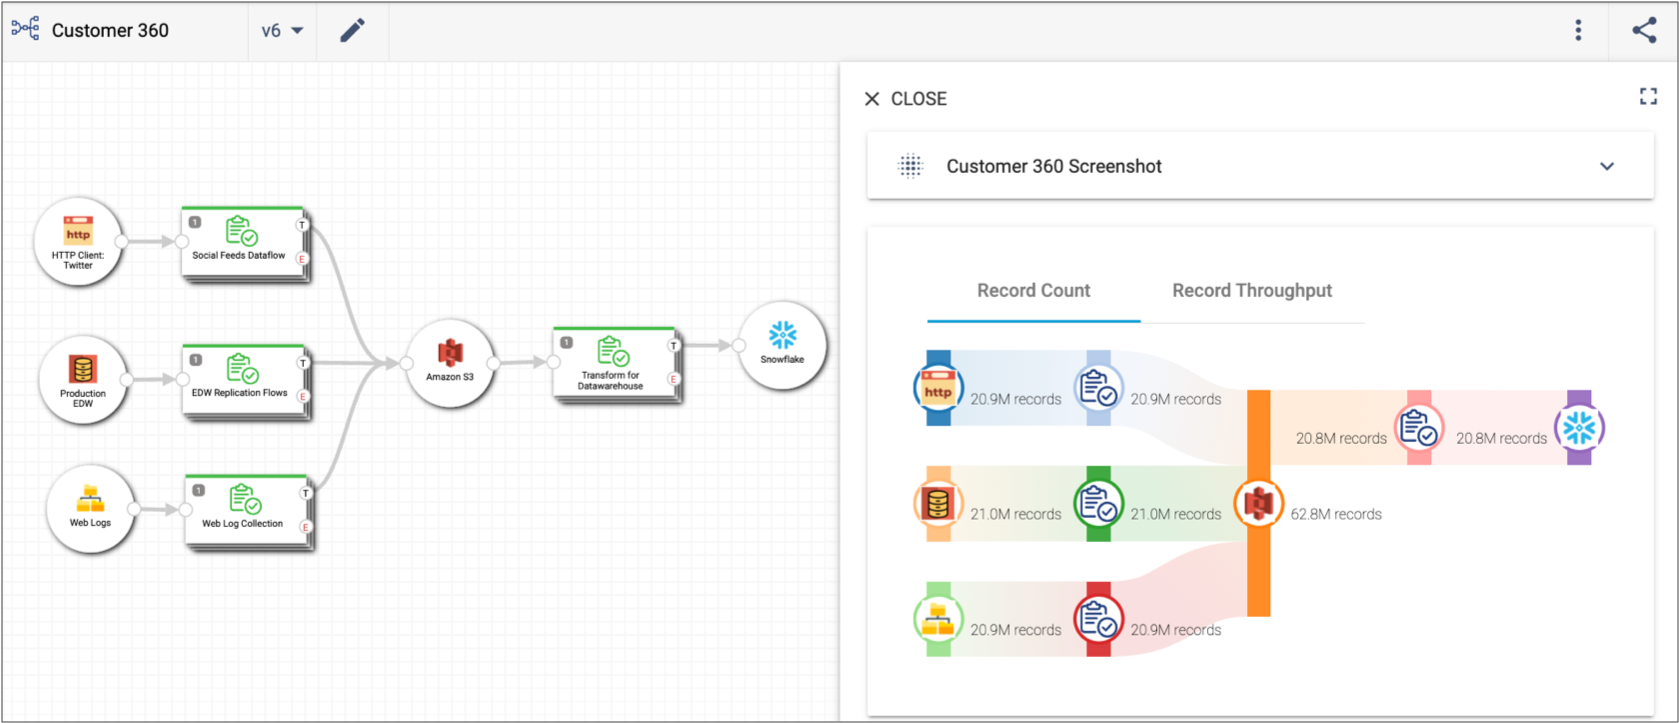
To measure the dataflows in a topology, simply click the name of a topology in the Topologies view. Control Hub displays the mapped jobs and systems in the canvas and displays a summary record count diagram for the topology in the detail pane. Click the canvas to measure the health of the entire topology. Select a job or system in the canvas to view statistics and monitoring details for that piece of the topology.
The following image shows the overall progress of a topology:
Monitor Jobs and Systems
In addition to measuring the health and progress of the overall topology, you can drill into the details of a single active job or system to monitor the performance of that component.
If you select an active job or system in the canvas, you can monitor real-time statistics and error information for that particular job or system in the detail pane.
The detail pane displays the real-time statistics for the job. The detail pane also displays any metric, data, and data drift alerts configured on the pipeline and triggered during the pipeline run.
The detail pane includes other sections which provide you with more insight into the progress and configuration of the job. For example, if you expand the pipeline section, you can view the complete design of the pipeline. When you select an active job in a topology canvas, you can access the same information as when you monitor the job from the Job Instances view. For more information, see Monitoring Jobs.
Just as you can drill into the monitoring details for a job, you can also drill into the details of an origin, destination, or error system. Select a system in the topology canvas to view the record count and throughput of each input and output job to that system.