Monitor Topologies with Data SLAs
A data SLA (service level agreement) defines the data processing rates that jobs within a topology must meet.
In addition to measuring the performance of jobs within a topology, you can configure data SLAs to define the expected thresholds of the data throughput rate or the error record rate. Data SLAs trigger an alert when the specified threshold is reached. Data SLA alerts provide immediate feedback on the data processing rates expected by your team. They enable you to monitor your data operations and quickly investigate issues that arise, ensuring that data is delivered in a timely manner.
You configure data SLAs on the jobs included in a topology. Define each data SLA for one job in the topology.
- Throughput rate - Number of records processed per second.
- Error rate - Number of error records encountered per second.
For each parameter, you define either a minimum or maximum value for the threshold. You also define the alert text that displays in the Alerts view when the data SLA triggers an alert.
Example
You are part of the data operations team at an oil and gas company that analyzes data to improve efficiency and reduce operational costs. Your company gathers data from equipment sensors which must be monitored in real time to avoid failures. Your data operations team is responsible for collecting and cleansing sensor data to quickly make it available to the analytics team for further analysis.
You work under a strict time line and have service level agreements with the analytics team to ensure that cleansed data is made available to them in a timely manner. One of the SLAs states that the Sensor Collection job must process approximately 2,000 records per second. You need to be immediately notified when the throughput falls above or below that average so that you can resolve any performance issues.
You define and activate a data SLA that triggers an alert when the Sensor Collection job encounters a throughput rate of more than 3,000 records per second. You define and activate another data SLA that triggers an alert when the same job encounters a throughput rate less than 1,500 records per second.
You start the jobs, and begin monitoring their progress. After several days, one of
the equipment sensors goes offline, causing the throughput rate for the Sensor
Collection job to fall below the threshold of 1,500 records per second. As a result,
the data SLA triggers an alert and displays a red Alerts icon (![]() ) in the top toolbar of Control Hub.
) in the top toolbar of Control Hub.
Since the triggered data SLA immediately notifies you that your service agreement with the analytics team is not being met, you can quickly investigate and resolve the issue.
Creating Data SLAs
Create data SLAs to define the expected thresholds of the data processing rates for a job. Define each data SLA for one job in the topology.
You can create data SLAs for active or inactive jobs in the topology.
- View the details of a topology.
-
In the Data SLA section, click the
Add icon:
 .
.
-
On the Add Data SLA window, configure the following
properties:
Data SLA Property Description Label Label for the data SLA. Job Job that the data SLA is defined for. QOS Parameter Quality of service parameter to measure: - Throughput rate - Number of records processed per second.
- Error rate - Number of error records encountered per second.
Function Type Specifies whether the data SLA measures a maximum or minimum value. Max or Min Value Value of the expected threshold. The data SLA triggers an alert when this threshold is reached.
Alert Text Text to display when the alert is triggered. -
Click Save.
By default, data SLA alerts are inactive. You must activate them before they can trigger an alert.
-
Select the new data SLA in the list, and then click the
Activate icon:
 .
.
Managing Data SLA Alerts
When a data SLA triggers an alert, Control Hub
displays a red Alerts icon (![]() ) in the top toolbar and lists the alert in the Alerts
view.
) in the top toolbar and lists the alert in the Alerts
view.
The following image displays an active alert in the Alerts view:
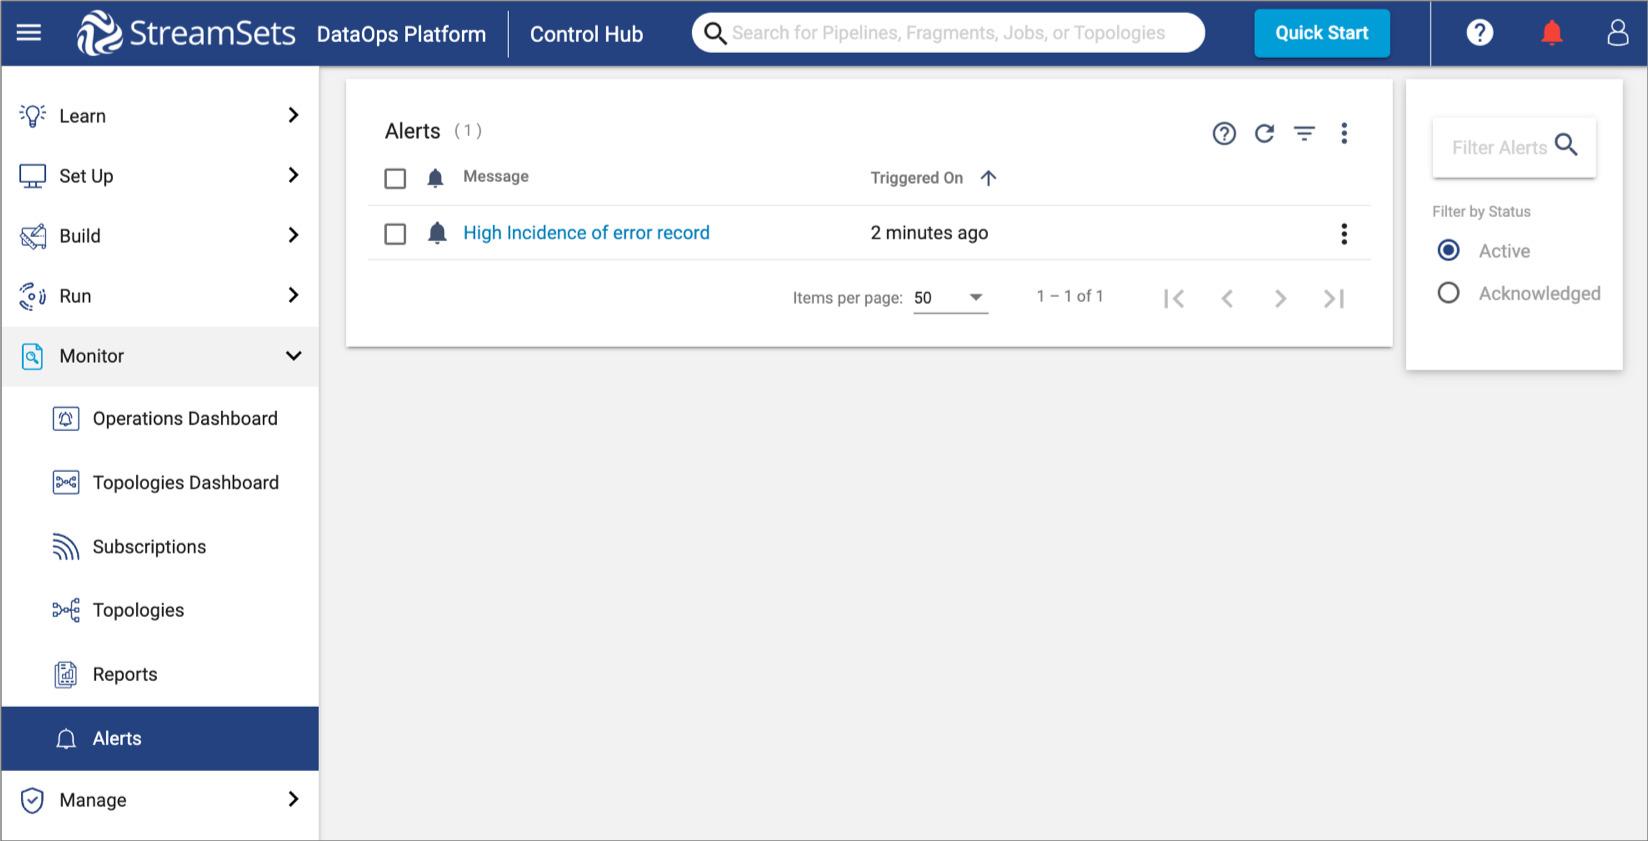
To view details about the data SLA threshold that was reached, click the alert message in the Alerts view. Control Hub opens the topology where the data SLA was configured. Open the topology detail pane, and then locate the Data SLA section in the detail pane. Click the data SLA label to display the details of the measured parameter.
You can modify the data SLA in real time. For example, while viewing a triggered alert, you might realize that you incorrectly configured the maximum or minimum value. Simply edit the value and click Save. The data SLA graph immediately reflects the modified threshold value.