Operations Dashboard
The Operations Dashboard provides a summary of triggered alerts, jobs with errors, offline execution engines, and unhealthy engines that have exceeded their resource thresholds. Use the dashboard to monitor and troubleshoot jobs.
To view the dashboard, click in the Navigation panel. The Operations Dashboard includes the following
sections:
- Summaries
- Displays a summary of the number of active jobs, jobs with errors, active and acknowledged alerts, offline execution engines, and unhealthy engines that have exceeded their resource thresholds.
- Alerts list
- Displays a list of active and acknowledged data SLA and pipeline alerts. In
the Actions column for each listed alert, you can acknowledge the alert or
view the job for the alert. Click the Reports icon
(
 ) to view the data in a report.
 - Jobs in error state list
- Displays a list of jobs that have a red status, indicating that an error has
occurred that must be resolved. In the Actions column for each listed job,
you can view the job, job history, job logs, or pipeline included in the
job. Click the Reports icon ()
to view the data in a report.
- Engine summaries
- Displays a summary of execution engines, including the number of running engines and engines that have exceeded their maximum memory or CPU threshold.
- Offline or unhealthy engines list
- Displays a list of execution engines that are offline or that are unhealthy
because they have exceeded their resource thresholds. In the Actions column
for each listed engine, you can view the engine details. Click the
Reports icon ()
to view the data in a report.
- Engine charts
- Displays charts about the execution engines, including the most CPU and memory intensive engines.
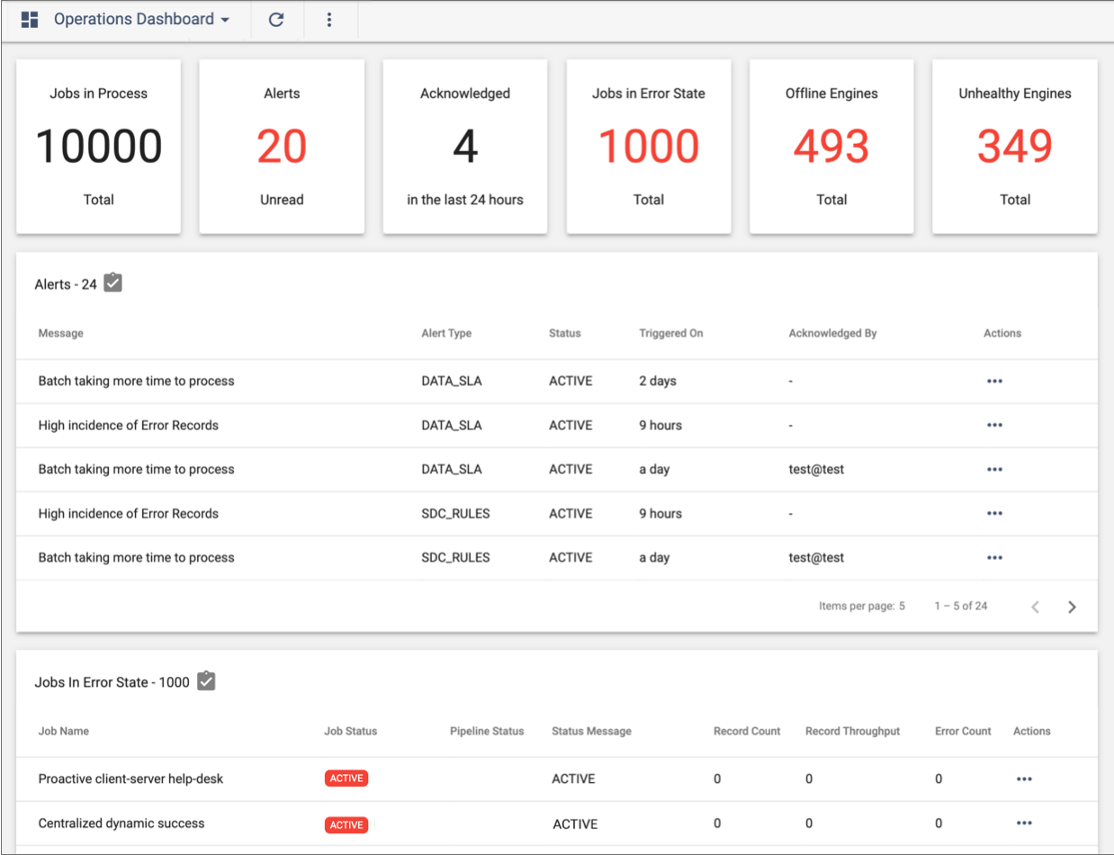
The following image displays a sample operations dashboard: