Topologies Dashboard
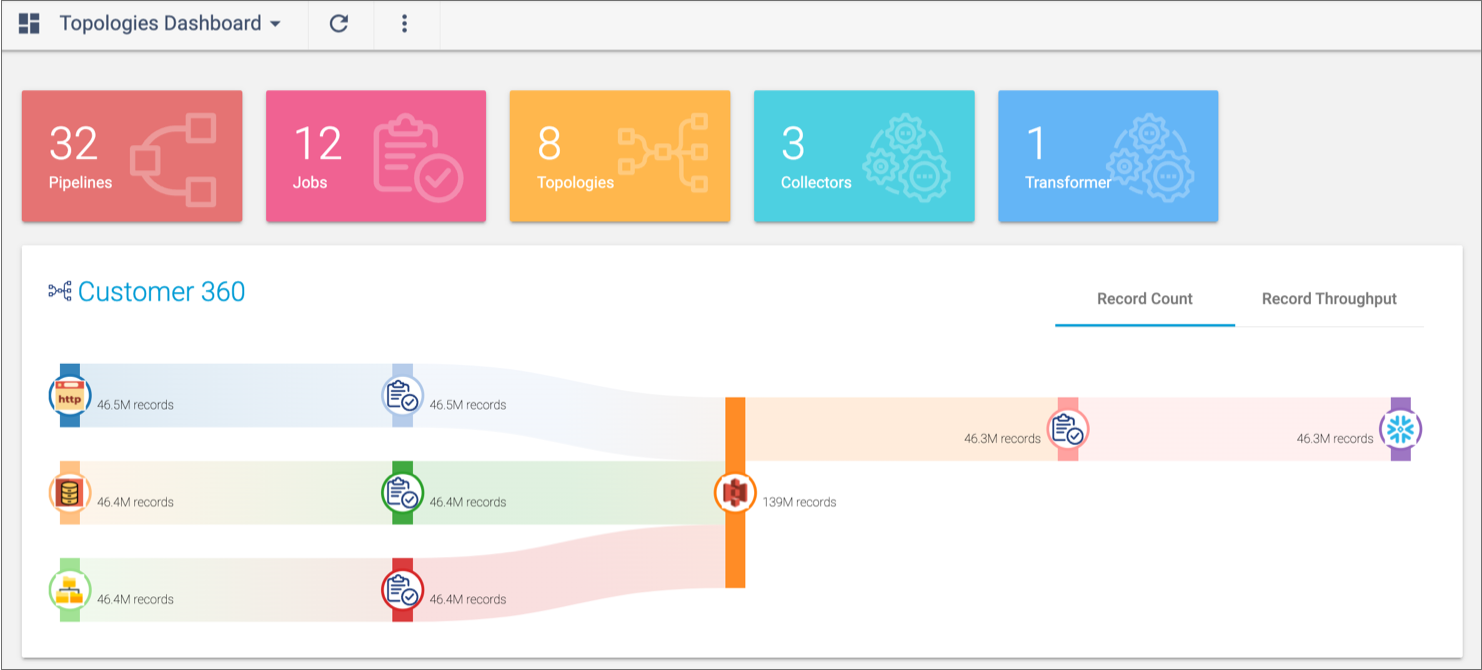
The Topologies Dashboard provides a summary of the number of pipelines, jobs, topologies, and execution engines that you have access to. If you have the Organization Administrator role, the dashboard also lists the number of users in your organization. The dashboard also displays the record count diagram for each topology.
To view the dashboard, click in the Navigation panel. Click one of the summaries to display the view for that object. Or click a topology record count diagram to view the details for that topology.
The following image displays a sample topologies dashboard: