Alerts
Alerts include data SLA and pipeline alerts that have been triggered and error messages that have briefly displayed in the UI. You can view both triggered alerts and a history of error messages when you click the Alerts icon. You can view details about triggered alerts by clicking in the Navigation panel.
Click the Alerts icon (![]() ) in the top toolbar to view the following alerts:
) in the top toolbar to view the following alerts:
- Triggered data SLA and pipeline alerts - Displays all triggered alerts that have not
been acknowledged. Click an alert to manage the alert details.Note: If the defined alert text exceeds 255 characters, Control Hub truncates the text to 244 characters and adds a
[TRUNCATED]suffix to the text.Or, click View All to view and acknowledge all triggered alerts. You can filter the view by active or acknowledged alerts. Control Hub retains acknowledged alerts for 30 days, and then purges them.
- History of error messages - Displays recent error messages that briefly display in the UI. Click an error message to dismiss the message. Or, click Dismiss All to dismiss all of the messages.
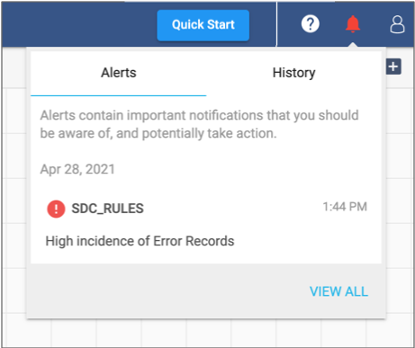
The following image displays a triggered pipeline alert after clicking the Alerts icon:
Click in the Navigation panel to view and acknowledge triggered alerts. You can filter the view by active or acknowledged alerts. Control Hub retains acknowledged alerts for 30 days, and then purges them.