Topologies Overview
A topology provides an interactive end-to-end view of data as it traverses multiple pipelines that work together.
You create a topology in Control Hub to complete the following tasks:
- Map related jobs into a single view
-
You map multiple related jobs into a topology canvas. You can map all dataflow activities that serve the needs of one business function in a single topology.
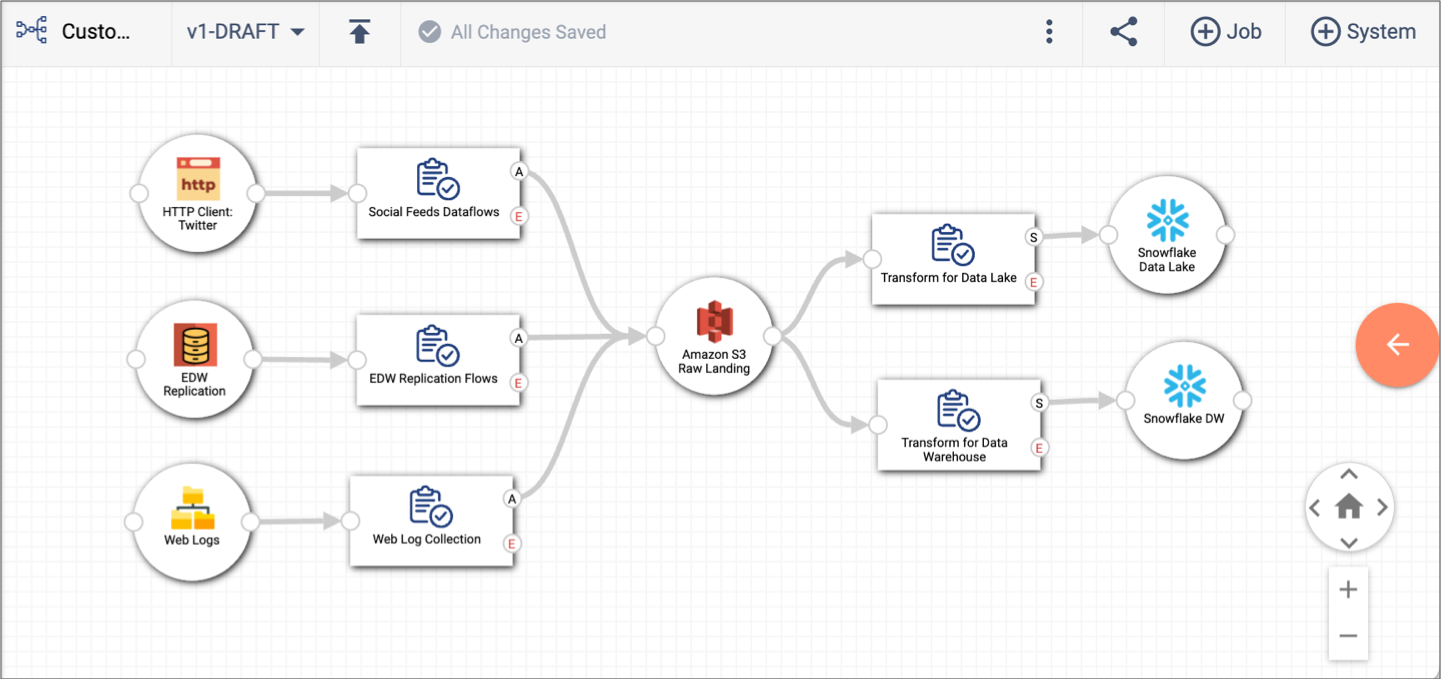
For example, the following image shows a topology that provides a 360-degree view of customers. The topology includes dataflows that collect customer data from multiple source systems and write the data to a raw landing area in Amazon S3. Additional dataflows transform and structure the data before writing the data to additional systems for analysis. The topology includes multiple jobs and connecting systems, providing a complete view of all customer dataflows:

Within a single topology, you can map multiple dataflows into or out of a single connecting system. For example in the topology above, we can see that three dataflows write into the Amazon S3 system and two other dataflows read from that system.
- Measure the performance of all jobs in the topology
-
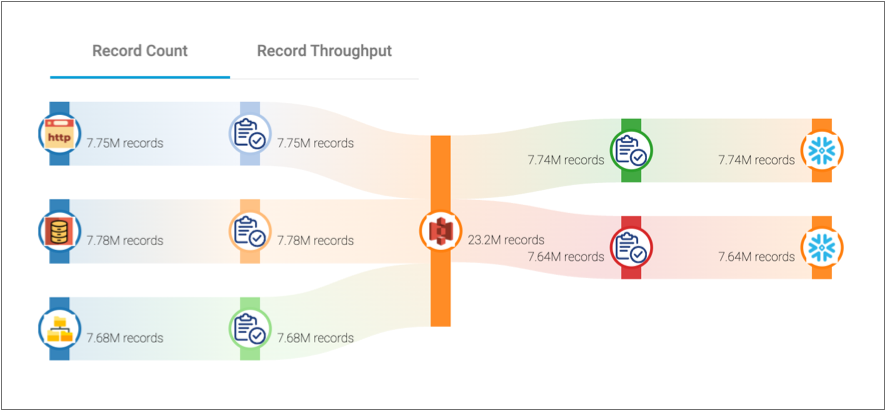
After you start the jobs included in a topology, you can measure the health and performance of all jobs and systems in the topology. The topology detail pane provides an overall view into the performance of the jobs and systems mapped in the topology canvas. Double-click the topology canvas or click the Open Detail Pane arrow to display the detail pane.
For example, let's look at the following record count diagram in the detail pane for our Customer 360 topology. Notice how the diagram displays the current record count for each component mapped in the topology canvas above:

After you finish designing a topology, you publish the topology to indicate that the topology is final. You can publish multiple versions of a topology. Control Hub maintains the version history.