Monitoring Jobs
After you start a job, you can monitor the statistics, error information, logs, and alerts about all remote pipeline instances run from the job. During draft runs or job runs for Data Collector pipelines, you can also capture and review a snapshot of the data being processed.
To monitor a job, simply click the name of an active job in the Job Instances view, and then click Monitor Job. Control Hub displays the pipeline in the canvas and displays real-time statistics for the job in the monitor panel below the canvas. Click the canvas to view statistics for the entire job. Select a stage in the canvas to view statistics for the stage.
Job Monitoring UI
When you monitor a job, Control Hub displays the pipeline in the canvas and displays real-time statistics for the job in the monitor panel below the canvas.
Control Hub
provides both a new job monitoring
UI and a classic job
monitoring UI. To switch the UI while monitoring a job, click the
More icon (![]() ) and then click Switch to Classic UI
or Switch to New UI.
) and then click Switch to Classic UI
or Switch to New UI.
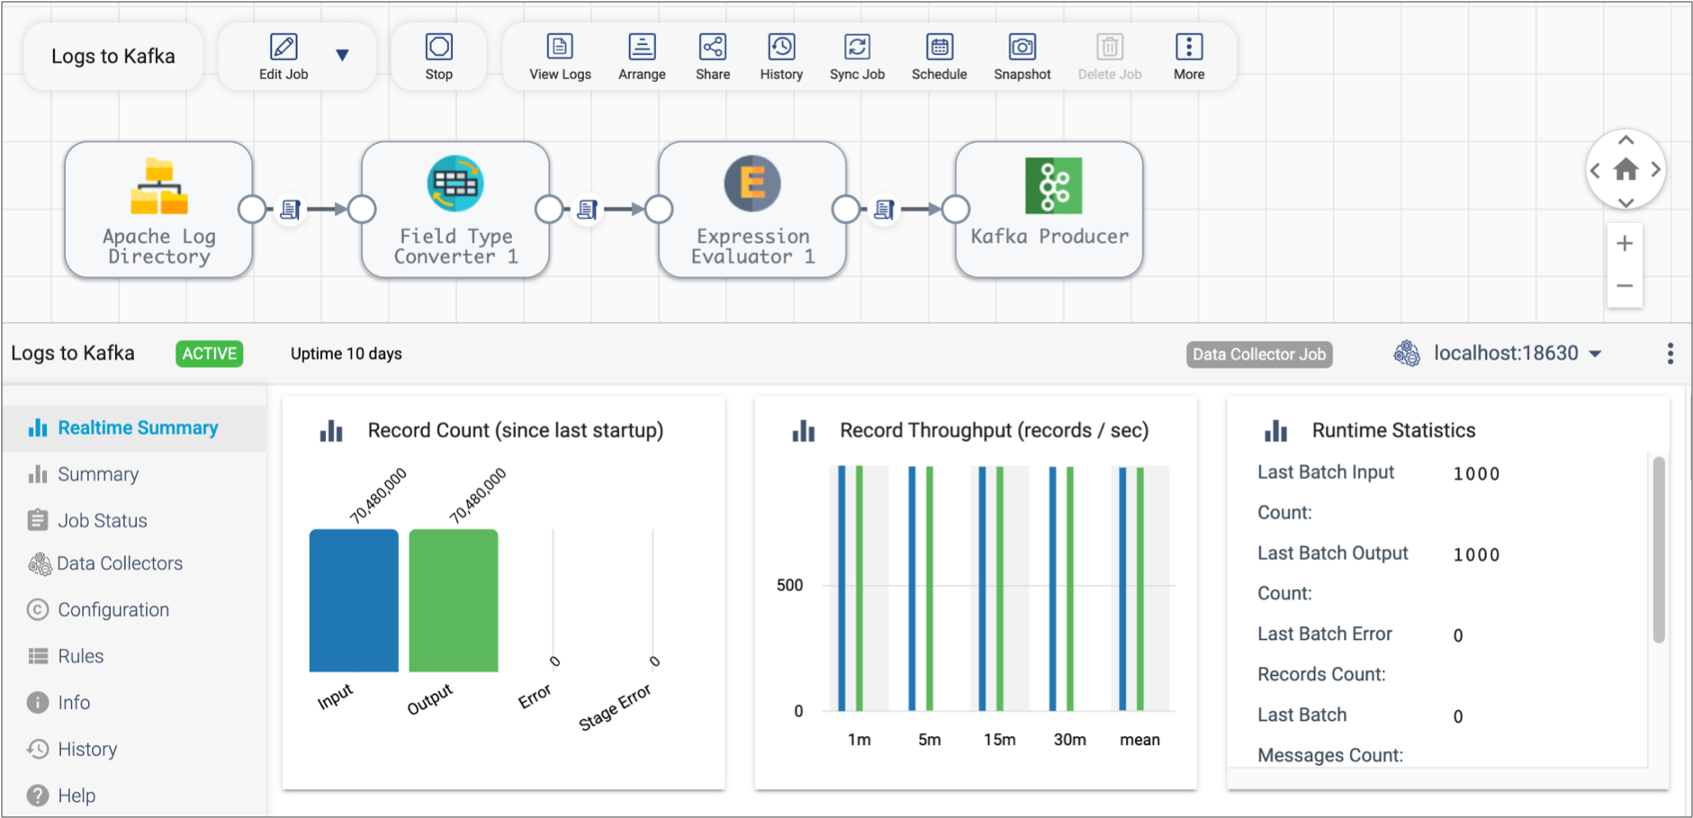
New Job Monitoring UI
The following image shows the new UI when you monitor a job:
| Icon | Name | Description |
|---|---|---|
| Edit Job selection | View or edit the latest version of the pipeline included in the job. | |
| Stop | Stop the job. | |
| View Logs | View logs for the execution engine running the remote pipeline instance. Available for Data Collector and Transformer jobs. | |
 |
Arrange | Arrange the stages in the pipeline. |
 |
Share | Share the job with other users and groups, as described in Permissions. |
| History | Displays the History tab in the Monitoring panel. | |
| Synchronize Job | Synchronize an active job after you have updated the labels assigned to execution engines. | |
| Schedule | Schedule the job to start, stop, or upgrade to the latest pipeline version on a regular basis. | |
| Snapshot | Capture and review a snapshot of the data being processed during draft runs or job runs for Data Collector pipelines. | |
| Delete Job | Delete an inactive job. | |
| More | Switch to the classic job monitoring UI. | |
| Select Execution Engine | Select a specific execution engine to view statistics for the remote pipeline instance running on that engine. |
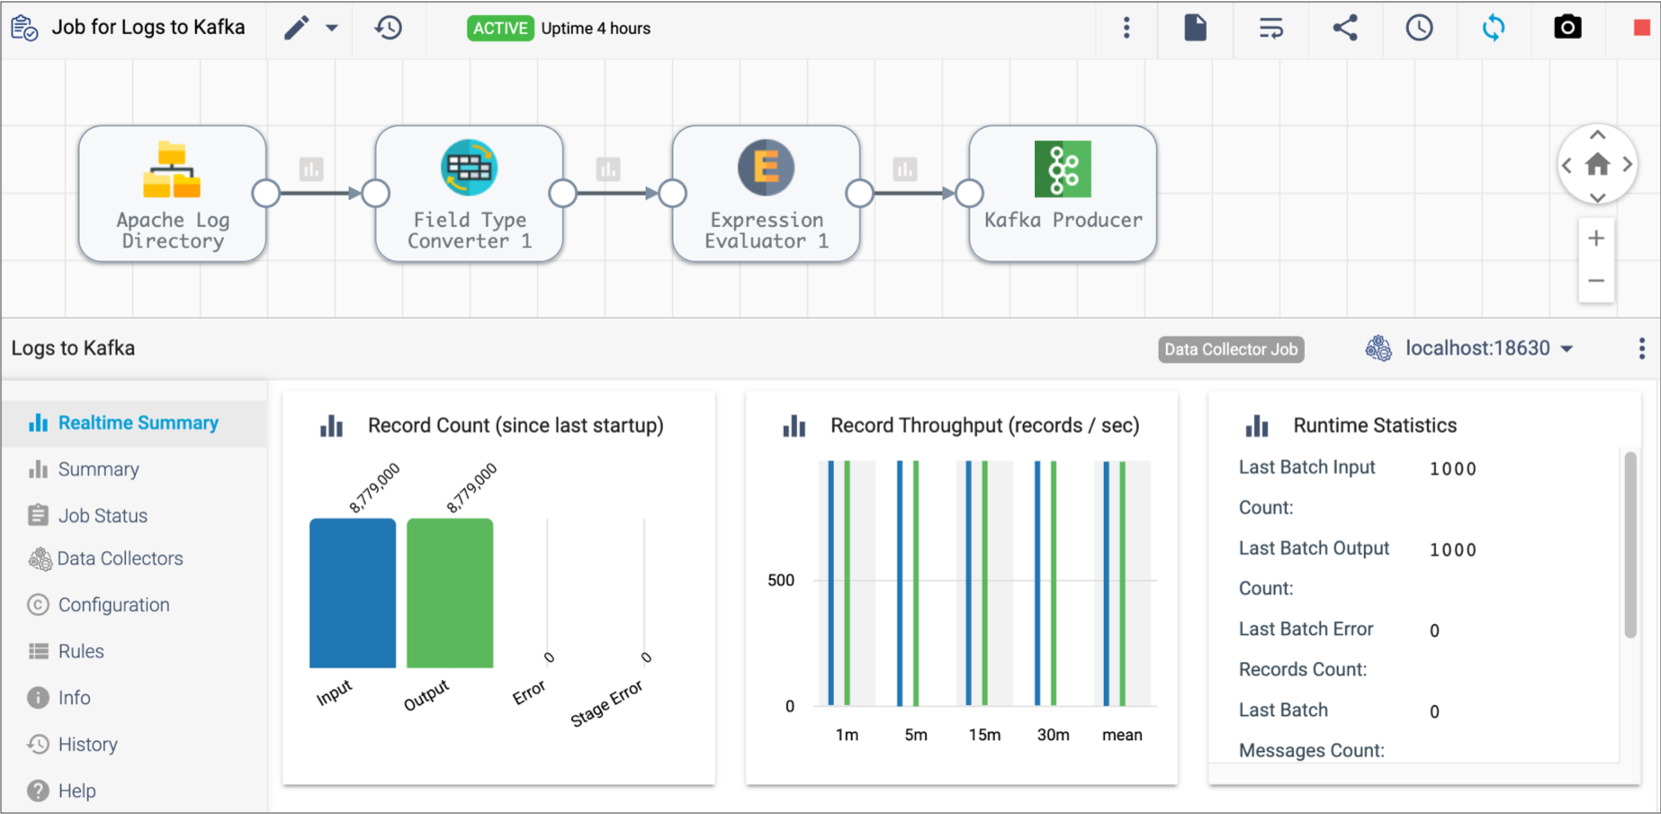
Classic Job Monitoring UI
The following image shows the classic UI when you monitor a job:
| Icon | Name | Description |
|---|---|---|
| Edit Job selection | View or edit the latest version of the pipeline included in the job. | |
| Job History | Displays the History tab in the Monitoring panel. | |
| More Options | Switch to the new job monitoring UI. | |
| View Logs | View logs for the execution engine running the remote pipeline instance. Available for Data Collector and Transformer jobs. | |
| Auto Arrange | Arrange the stages in the pipeline. | |
| Share | Share the job with other users and groups, as described in Permissions. | |
| Schedule Job | Schedule the job to start, stop, or upgrade to the latest pipeline version on a regular basis. | |
| Synchronize Job | Synchronize an active job after you have updated the labels assigned to execution engines. | |
| Snapshots | Capture and review a snapshot of the data being processed during draft runs or job runs for Data Collector pipelines. | |
| Stop Job | Stop the job. | |
| Select Execution Engine | Select a specific execution engine to view statistics for the remote pipeline instance running on that engine. |
Job Monitoring Tabs
- Realtime Summary - Real-time statistics and metrics for the active job. Also
displays custom metrics for Data Collector stages that provide custom metrics and displays available pipeline runners
for Data Collector multithreaded pipelines. For more information, see Custom Metrics and Multithreaded Pipelines in the Data Collector documentation.
When the job stops, these real-time statistics are no longer visible.
Statistics and metrics on the Realtime Summary tab are updated every two seconds.
- Summary - Statistics and metrics saved to Control Hub.
Statistics and metrics are saved to Control Hub every one minute by default. As a result, you must wait at least one minute to see data in the Summary tab after you start a job. You can change the default value by modifying the Statistics Refresh Interval property for the job. The charts in the Summary tab are updated based on the chart settings that you select from the More icon (
 ).
). - Job Status - Status of the job. For a description of each status, see Job Status.
- Engine type - List of engines running each remote pipeline instance.
- Configuration - Configuration details for the pipeline or selected stage.
- Errors - Error records encountered by a pipeline stage in an active Data Collector job. Displays when you select a stage in the canvas that has encountered errors.
- Rules - Metric alert rules, data rules, and email IDs for alerts.
- Info - General information about the pipeline or selected stage or link.
- History - Job history, including the start and finish time of previous job runs and a summary of each run.
Job Status
When you view the list of jobs in the Job Instances view or when you monitor a job, you can view the job status. You can also view the status of remote pipeline instances run from active jobs.
The job status is color-coded, providing an easy visual indicator of which jobs need your attention. A red status indicates that an error has occurred that you must resolve. A green status indicates that all is well.
The following table describes each job status:
| Job Status | Description |
|---|---|
| Job is inactive. A job that has never run has an inactive status. A job transitions from an active to an inactive status when you stop the job or when all remote pipeline instances run from the job have reached a finished state. | |
| Job is inactive after stopping automatically due to an error. For example, a red inactive status can occur when either the pipeline or Data Collector generates an error that causes Control Hub to stop the job. |
|
| Job is inactive and has an error that you must acknowledge. This status can occur when at least one execution engine reported an error while attempting to stop the remote pipeline instance. For example, one Data Collector might have shut down and so could not properly stop the remote pipeline instance. You cannot perform actions on jobs with an
|
|
| Control Hub is in the process of starting the job. You cannot perform actions on activating jobs. |
|
| Job is active and remote pipeline instances are running on the execution engines assigned the same labels as the job. | |
| Job is active, but there are some issues you must look into. For
example, a red active status can indicate one of the following
issues:
|
|
 |
Control Hub is in the process of stopping a job as requested or as expected. Control Hub is communicating with the execution engines to stop all remote
pipeline instances. You cannot perform actions on deactivating jobs. |
| Control Hub is in the process of stopping a job automatically due to an error.
Control Hub is communicating with the execution engines to stop all remote
pipeline instances. You cannot perform actions on deactivating jobs. |
Pipeline Status
When you view the list of jobs in the Job Instances view, you can view the status of remote pipeline instances run from active jobs. Inactive jobs do not display a pipeline status.
The Job Instances view displays a pipeline status when all remote pipeline instances run from the active job have the same status. When remote pipeline instances run from the active job have different statuses, the Job Instances view displays an asterisk (*) for the pipeline status.
| Pipeline Status Color | Description |
|---|---|
| Green | A green pipeline status indicates that the engine sent the pipeline status to Control Hub less than 2 minutes ago. |
| Red | A red pipeline status indicates that the engine sent the pipeline status to Control Hub over 2 minutes ago. In this case, the status may no longer be accurate. |
For example, a green Running status indicates that the pipeline is running and that Data Collector updated Control Hub with that status within the last 2 minutes. A red Running status indicates that Data Collector last reported the pipeline as running, but Data Collector has not updated the pipeline status for over 2 minutes. As a result, the pipeline status might have changed in that time.
The following pipeline statuses often display in the Job Instances view:
- Edited - The pipeline has been created or modified, and has not run since the last modification.
- Finished - The pipeline has completed all expected processing and has stopped running.
- Run error - The pipeline encountered an error while running and stopped.
- Running - The pipeline is running.
- Stopped - The pipeline was manually stopped.
- Start error - The pipeline encountered an error while starting and failed to start.
- Stop error - The pipeline encountered an error while stopping.
The following pipeline statuses are transient and rarely display in the Job Instances view:
- Connecting - The pipeline is preparing to restart after an execution engine restart.
- Disconnected - The pipeline is disconnected from external systems, typically because the engine is restarting or shutting down.
- Disconnecting - The pipeline is in the process of disconnecting from external systems, typically because the engine is restarting or shutting down.
- Finishing - The pipeline is in the process of finishing all expected processing.
- Retry - The pipeline is trying to run after encountering an error while running. This occurs only when the pipeline is configured for a retry upon error.
- Running error - The pipeline encounters errors while running.
- Starting - The pipeline is initializing, but hasn't started yet.
- Starting error - The pipeline encounters errors while starting.
- Stopping - The pipeline is in the process of stopping after a manual request to stop.
- Stopping error - The pipeline encounters errors while stopping.
Pipeline Status Examples
- Starting a pipeline
- When a job successfully starts a pipeline for the first time, a pipeline
transitions through the following
statuses:
(Edited)... Starting... Running - Stopping or restarting an engine
-
When an engine shuts down, running pipelines transition through the following statuses:
(Running)... Disconnecting... Disconnected - Retrying a Data Collector pipeline
- When a Data Collector pipeline is configured to retry upon error, Data Collector performs the specified number of retries when the pipeline encounters errors while running.
- Stopping a pipeline
- When you successfully stop a job, the pipeline transitions through the
following
statuses:
(Running)... Stopping... Stopped
Jobs and Unresponsive Data Collector Engines
When you start a Data Collector job, Control Hub sends an instance of the pipeline to a Data Collector engine. The engine remotely runs the pipeline instance, communicating with Control Hub at regular one minute intervals to report a heartbeat, pipeline status, and last-saved offset.
If a Data Collector engine fails to communicate with Control Hub, Control Hub considers the engine unresponsive.
Engines can become unresponsive for the following reasons:
- The engine gracefully shuts down.
Control Hub typically considers the engine unresponsive within one minute.
- The engine loses its connection to Control Hub.
Control Hub considers the engine unresponsive after the maximum engine heartbeat interval expires, 5 minutes by default.
- The engine unexpectedly shuts down.
Control Hub considers the engine unresponsive after the maximum engine heartbeat interval expires, 5 minutes by default.
Control Hub handles currently active jobs on unresponsive Data Collector engines differently, depending on the reason for the unresponsive engine and whether pipeline failover is enabled for the job.
Engine Gracefully Shuts Down
- The engine receives a shut-down request from Control Hub. A Control Hub shut-down request can occur when a user stops a deployment or shuts down or restarts engines.
- A user presses Ctrl+C in the command prompt for a self-managed deployment with an engine tarball installation.
- A user runs the Docker stop command for a self-managed deployment with an engine Docker installation.
- A user terminates the VM instance where the engine is running for a Control Hub-managed deployment.
When an engine gracefully shuts down while running a pipeline, Control Hub immediately displays a green Active status for the job and a green Disconnected status for the pipeline.
If the engine restarts within one minute, the engine continues running the pipeline using the last-saved offset stored in data files on the engine machine. The job remains in a green Active status, and the pipeline transitions to a green Running status.
If the engine does not restart and misses the first communication interval, the job remains in a green Active status and the pipeline transitions to a red Disconnected status.
After approximately one minute, Control Hub typically considers the engine unresponsive. In some cases, Control Hub might wait for the maximum engine heartbeat interval to expire, 5 minutes by default, before considering the engine unresponsive.
- Pipeline failover disabled
- The job transitions to a red Active status, and the pipeline remains in a red Disconnected status.
- Pipeline failover enabled
- Control Hub restarts the pipeline on another available engine. The new engine starts the pipeline at the last-saved offset. The job remains in a green Active status, and the pipeline transitions to a green Running status.
Engine Loses Connection
When an unexpected network or system outage occurs, a Data Collector engine running a pipeline can lose its connection to Control Hub. The engine continues to remotely run the pipeline, temporarily saving the pipeline status and last-saved offset in data files on the engine machine.
After the engine misses the first communication interval, Control Hub displays a green Active status for the job and a green Disconnected status for the pipeline.
If the engine reconnects to Control Hub before the maximum engine heartbeat interval expires, the engine reports the saved pipeline data to Control Hub. The job remains in a green Active status, and the pipeline transitions to a green Running status.
- Pipeline failover disabled
- The job transitions to a red Active status, and the pipeline transitions to a red Disconnected status.
- Pipeline failover enabled
- Control Hub restarts the pipeline on another available engine. The new engine starts the pipeline at the last-saved offset. The job remains in a green Active status, and the pipeline transitions to a green Running status.
Engine Unexpectedly Shuts Down
When a Data Collector engine unexpectedly shuts down while running a pipeline, engine processes do not terminate gracefully. As a result, unexpected behavior can occur.
After the engine misses the first communication interval, Control Hub displays a green Active status for the job and a red Running status for the pipeline.
If the engine restarts before the maximum engine heartbeat interval expires, the engine continues running the pipeline using the last-saved offset stored in data files on the engine machine. The job remains in a green Active status, and the pipeline transitions to a green Running status. However, data loss or data duplication can occur because the offset might not have been correctly saved before the engine shut down.
- Pipeline failover disabled
- The job transitions to a red Active status, and the pipeline remains in a red Running status.
- Pipeline failover enabled
- Control Hub restarts the pipeline on another available engine. The new engine starts the pipeline at the last-saved offset. The job remains in a green Active status, and the pipeline transitions to a green Running status. Data loss or data duplication can occur because the offset might not have been correctly saved before the engine shut down.
Acknowledging Job Errors
By default when a job has an inactive error status, you cannot perform actions on the job until you acknowledge the error message. You can acknowledge job errors from the Job Instances view or when monitoring a job. You can also acknowledge job errors from a topology.
- Acknowledging errors from the Job Instances view
-
To acknowledge job errors from the Job Instances view, click the row listing the job with the inactive error to display the job details. The details list the error message for the job. Review the message, taking action as needed, and then click Acknowledge Errors.
- Acknowledging errors when monitoring a job
-
To acknowledge job errors when monitoring a job with an inactive error, click the Job Status tab in the monitoring panel. The Job Status tab lists the error message for the job. Review the message, taking action as needed, and then click the Acknowledge Errors icon (
 )
in the toolbar, as displayed in the following image:
)
in the toolbar, as displayed in the following image: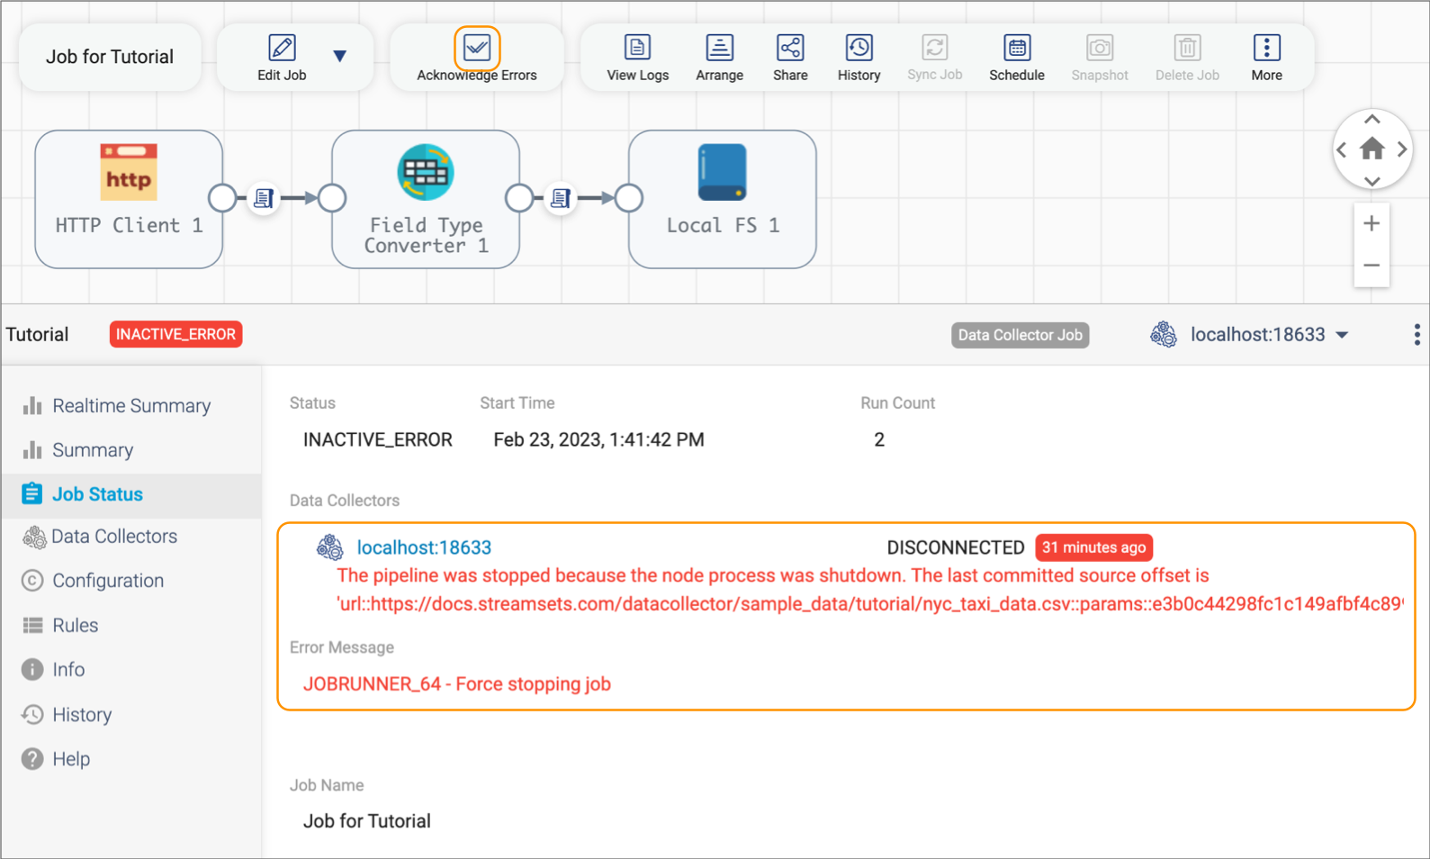
Resetting Metrics for Jobs
When a job is inactive, you can reset the metrics for the job by resetting the origin for the job. You might want to reset metrics when you are testing jobs and want to view the metrics from the current job run only.
For more information about resetting the origin, see Resetting the Origin for Jobs.
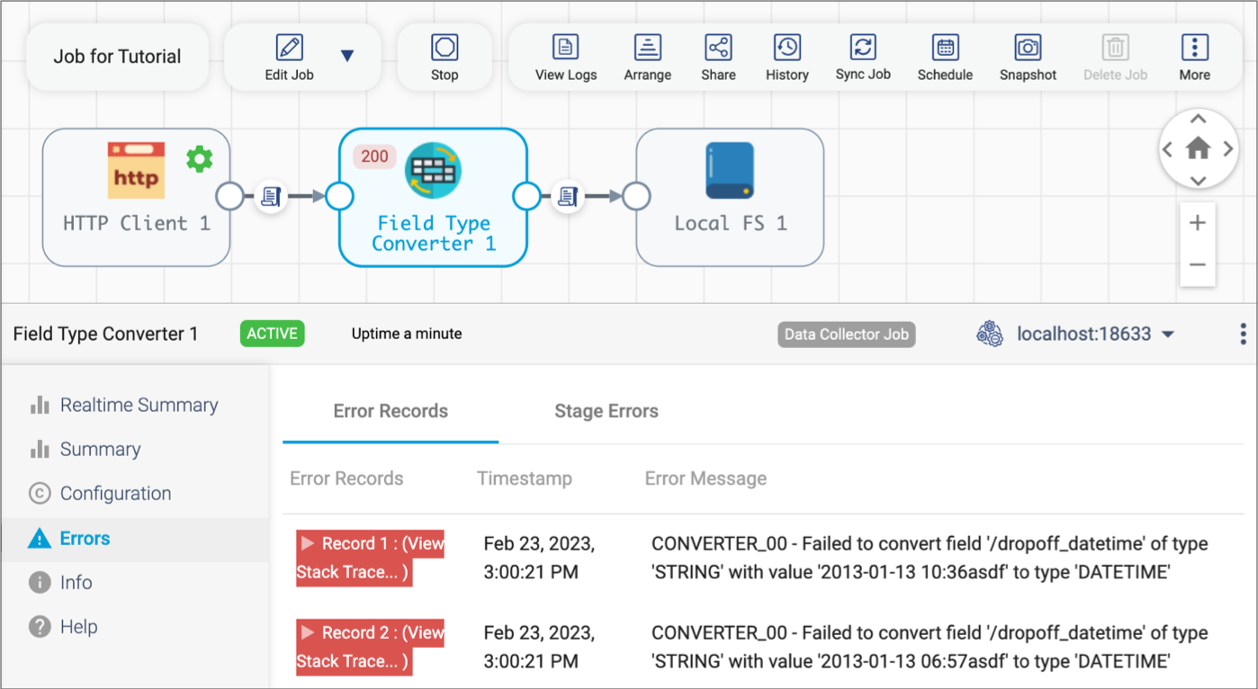
Monitoring Stage-Related Errors
When you monitor an active Data Collector job, you can view the errors related to each pipeline stage. Stage-related errors include the error records that the stage produces and other errors encountered by the stage.
To view stage-related errors, select the stage in the canvas and then click the Errors tab in the monitor panel. The Errors tab displays the following tabs:
- Error Records
-
Displays a sample of the 10 most recent error records with related error messages. You can expand and review the data in each error record. If the error was produced by an exception, you can click View Stack Trace to view the full stack trace.
- Stage Errors
- Displays a list of stage errors. Stage errors are operational errors, such as an origin being unable to create a record because of invalid source data.
The following image displays a sample Errors tab for a Field Type Converter processor that has encountered errors:
Logs
When monitoring an active job, you can view logs for the engine running the remote pipeline instance.
- Data Collector
- The Data Collector log includes information about the Data Collector engine, such as start-up messages and information about all pipelines running on the engine. As a result, you might see messages about pipelines being run from other active jobs when you view the log.
- Transformer
- You can view the following logs for Transformer jobs:
- Transformer log - The Transformer log provides information about the
Transformer application, such as start-up messages, user logins, or
pipeline display in the canvas.
The Transformer log can also include some information about local pipelines or cluster pipelines run on Hadoop YARN in client deployment mode. For these types of pipelines, the Spark driver program is launched on the local Transformer machine. As a result, some pipeline processing messages are included in the Transformer log. The Transformer log does not include information about other types of cluster pipelines.
- Spark driver log - The Spark driver log provides information about how Spark runs, previews, and validates pipelines.
- Transformer log - The Transformer log provides information about the
Transformer application, such as start-up messages, user logins, or
pipeline display in the canvas.
- Transformer for Snowflake
- The Transformer for Snowflake log includes information about the Transformer for Snowflake engine, such as start-up messages and information about all pipelines running on the engine. As a result, you might see messages about pipelines being run from other active jobs when you view the log.
Viewing the Execution Engine Log
You can view and download the execution engine log from the Control Hub UI.
-
As you monitor a job run, click the Select
Execution Engine icon (
 ) in the toolbar of the monitoring panel
and select the execution engine that you want to view logs for.
) in the toolbar of the monitoring panel
and select the execution engine that you want to view logs for.
-
Click the View Logs icon (
 ).
).
Control Hub displays the log for the selected execution engine. The log displays the last 50 KiB of messages.
- To view logs for another engine running the pipeline, select an engine from the Execution Engine property.
-
To filter the messages by log level, select a level from the
Severity list.
By default, the log displays messages for all severity levels.
- To refresh the log data, click Refresh.
- Click Close to close the log.
Viewing the Spark Driver Log
- Local pipelines
- Cluster pipelines run in Spark standalone mode
- Cluster pipelines run on Amazon EMR
- Cluster pipelines run on Hadoop YARN in client deployment mode
- Cluster pipelines run on Kubernetes
For all other cluster pipelines, the Spark driver program is launched remotely on one of the worker nodes inside the cluster. To view the Spark driver logs for these pipelines, access the Spark web UI for the application launched for the pipeline. Control Hub provides easy access to the Spark web UI for many cluster types.
-
As you monitor a Transformer job, click the Summary tab
in the Monitoring panel, and then click Driver Logs in
the Runtime Statistics section:
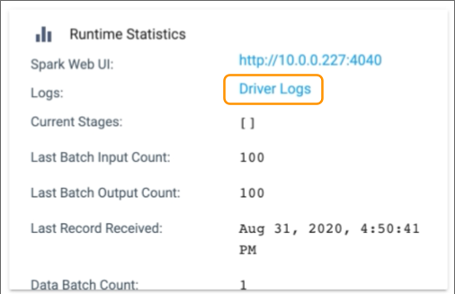
To view the Spark driver log for a previous Transformer job run, click the History tab in the Monitoring panel, and then click Driver Logs in the Summary column.
Control Hub displays the most recent driver log information.
- Click Refresh to view the latest data.
- To download the latest log data, click Download.
Cluster and Spark URLs
When you monitor a Transformer job for a cluster pipeline, the Monitoring panel provides URLs for the cluster or the Spark application that runs the pipeline.
Use the URL to access additional information about the cluster or Spark application. For example, the Spark web UI can include information such as completed jobs, memory usage, running executors, and the Spark driver log.
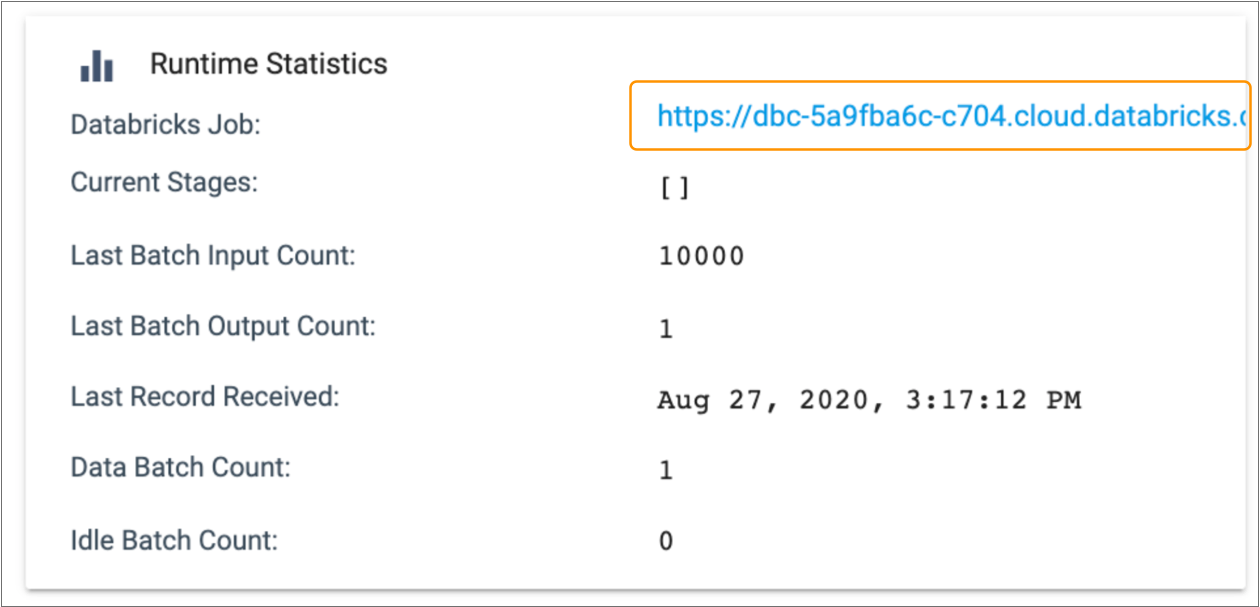
Cluster and Spark URLs display in the Runtime Statistics section of the Monitoring panel. For example, when you monitor a Databricks pipeline, the Databricks Job URL displays with the other runtime statistics, as follows:
| Cluster Manager Type | URL |
|---|---|
| Amazon EMR |
|
| Apache Spark for HD Insight 1 |
|
| Databricks |
|
| Dataproc |
|
| Hadoop YARN |
|
| Kubernetes |
|
| Spark Standalone |
|
1 Available in Transformer 4.0.x - 5.9.x.
Snapshots
A snapshot is a set of data captured as it moves through a running pipeline. You can capture and review snapshots during draft runs or job runs for Data Collector pipelines.
View a snapshot to verify how a Data Collector pipeline processes data. Like data preview, you can view how snapshot data moves through a pipeline stage by stage or across multiple stages. You can drill down to review the values of each record to determine if the stage or group of stages transforms data as expected.
Unlike data preview, you cannot edit data to perform testing when you review a snapshot. Instead, you can use the snapshot as source data for data preview. You might use a snapshot for data preview to test the pipeline with production data.
Snapshots captured for jobs are available for the duration of the job run. When you stop the job, all captured snapshots are deleted.
Snapshots captured for the previous draft run are still available after the draft run stops when using an authoring Data Collector 5.0.0 or later. For earlier Data Collector versions, all captured snapshots are deleted when you stop the draft run.
- Snapshots taken from a draft run use the selected authoring Data Collector.
- Snapshots taken while monitoring a job use the execution Data Collector for the job run. When there is more than one execution Data Collector, the snapshot uses the Data Collector selected in the Monitoring panel.
Failure Snapshots
When a draft run fails, Control Hub captures a failure snapshot which you can view to troubleshoot the problem. A failure snapshot is a partial snapshot that occurs automatically when the pipeline stops due to unexpected data.
A failure snapshot captures the data in the pipeline that was in memory when the problem occurred. As a result, a failure snapshot includes the data that caused the problem and might include other unrelated data, but does not include data in each stage like a full snapshot.
Data Collector pipelines generate the failure snapshot by default.
You can configure pipelines to skip generating the failure snapshot by clearing the Create Failure Snapshot pipeline property.
Viewing a Failure Snapshot
After a draft run generates a failure snapshot, you can review the snapshot to determine the cause of the error.
- As you view the draft pipeline in the pipeline canvas, click the More icon, and then click Snapshot.
-
In the Snapshots dialog box, find the failure snapshot
and click View.
Failure snapshots use the following naming convention:
Failure at
                            <time of failure>
. -
When the failure snapshot displays, click through the stages.
Stages that encountered no errors will typically not display any data. The stage that contains data should be the stage that encountered the errors. Examine the data that caused the errors and edit the pipeline as needed.
- To exit the snapshot review, click Close Snapshot.
Capturing and Viewing a Snapshot
You can capture a snapshot of data when you start or monitor a draft run of a Data Collector pipeline or when you monitor a Data Collector job.
After you capture a snapshot, you can view the snapshot data stage by stage or through a group of stages, like data preview.
-
As you monitor a draft run or a job run, click the Snapshot icon:
 .
.
-
In the Snapshots dialog box, click Capture
Snapshot to capture a set of data.
Control Hub captures a snapshot of the next batch that passes through the pipeline and displays it in the list.Tip: When using an authoring Data Collector 5.0.0 or later, you can capture a snapshot of the first batch of data. While viewing an inactive draft pipeline, click the More icon, click Snapshot, and then click Start & Capture Snapshot.
-
To view a snapshot, click View for the snapshot that you
want to use.
The canvas highlights the origin stage of the pipeline. The monitor panel displays snapshot data in the Output Data column. Since this is the origin of the pipeline, no input data displays.
- To view data for a different stage, select the stage in the canvas.
-
To view the snapshot for multiple stages, click
Multiple.
The canvas highlights the first stage and the last stage. The monitor panel displays the input and output data for the selected group of stages.
- To change the first stage in the group, select the current first stage and then select the desired stage.
- To change the last stage in the group, select the current last stage and then select the desired stage.
- To exit the snapshot review, click Close Snapshot.
Renaming a Snapshot
Snapshots use the following naming convention: Snapshot<number>, for example Snapshot1 or Snapshot2. You can rename a snapshot captured for a draft run or for a job run so that it is more easily identified.
For example, let's say that you've captured four snapshots for a draft run and would like to use Snapshot3 as the source data for a preview of the pipeline. You rename Snapshot3 to SnapshotForPreview so it's easier to identify that snapshot when you configure the source data for the preview.
-
As you monitor a draft run or a job run, click the Snapshot icon:
.
Or when viewing an inactive draft pipeline, click the More icon and then click Snapshot.
- In the Snapshots dialog box, click the name of the snapshot that you want to rename, and then type the new name.
- To exit the snapshot review, click Close Snapshot.
Downloading a Snapshot
When needed, you can download a snapshot captured for a draft run or job run. You might download a snapshot to use the Dev Snapshot Replaying origin to read records from the downloaded file.
When you download a snapshot, it downloads to the default download location on your machine.
-
As you monitor a draft run or a job run, click the Snapshot icon:
.
Or when viewing an inactive draft pipeline, click the More icon and then click Snapshot.
The Snapshots dialog box displays all available snapshots for the pipeline or job.
- Click Download for the snapshot that you want to download.
Deleting a Snapshot
-
As you monitor a draft run or a job run, click the Snapshot icon:
.
Or when viewing an inactive draft pipeline, click the More icon and then click Snapshot.
The Snapshots dialog box displays all available snapshots for the pipeline or job.
- Click Delete for the snapshot that you want to delete.
Viewing the Job Run History
You can view the run history of a job and a summary of each run when you configure or monitor a job.
- Run count
- Job status
- Time the job started or finished
- Input, output, and error record count for the job run
- Access to each job run summary
- Pipeline version included in the job run
- Last-saved offset, displayed when you expand the details of the job run
- Spark application ID and name
- Job status
- Time the job started or finished
- Input, output, and error record count for the job run
- Access to each job run summary and a link to the Spark driver logs depending on the pipeline type
- Pipeline version included in the job run
- Last-saved offset, displayed when you expand the details of the job run
Control Hub displays timestamps using the browser time zone, which is determined by your local operating system.
Click the History tab in the job properties or monitor panel to view the run history. The following image shows a sample run history:
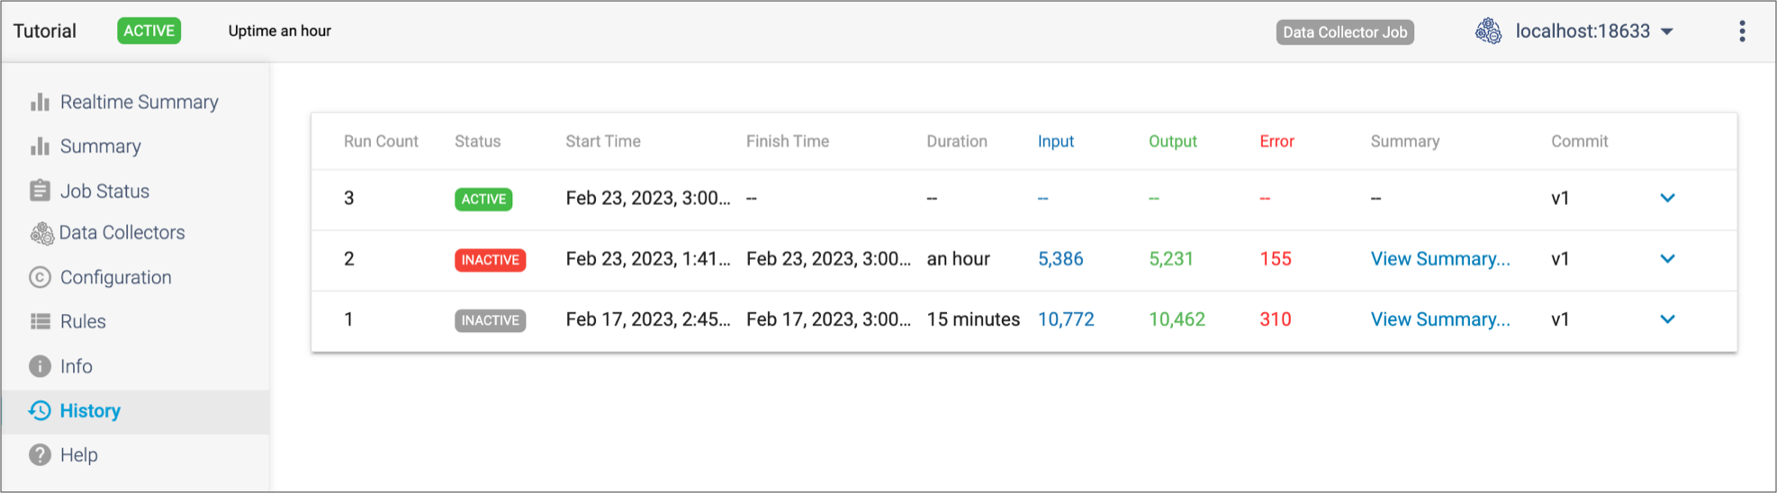
DELETED in the Commit column. Similarly, if Control Hub
cannot retrieve the pipeline version due to networking issues, the version displays as
UNKNOWN in the Commit column.Viewing a Run Summary
You can view a run summary for each job run when you view the job history.
- Input, output, and error record count for the job
- Input, output, and error record throughput for the job
- Batch processing statistics
To view a run summary, on the History tab of the job, click View Summary for a specific job run.