Monitoring Engines
When you view engine details in the Engines view, you can monitor the performance of the engine, the pipelines currently running on the engine, and the last time that the engine reported a heartbeat to Control Hub.
You can view configuration properties, all active Java threads, metric charts, logs, and directories for each engine. You can view information about the basic health of each Data Collector engine.
When the web browser uses direct engine REST APIs to communicate with engines, you can generate a support bundle for each engine. A support bundle includes the information required to troubleshoot various issues with the engine.
- Click in the Navigation panel.
- Click an engine type tab.
- Click an engine link to monitor the engine.
Performance
When you view the details of an engine in the Engines view, you can monitor the performance of the engine.
- CPU Load
- Percentage of CPU being used by the engine.
- Memory Used
- Amount of memory being used by the engine out of the total amount of memory allocated to that engine.
You can sort the list of engines by the CPU load or by the memory usage so that you can easily determine which engines are using the most resources.
dpm.remote.control.status.events.interval property in the
engine configuration properties when you edit a deployment. For more information,
see Engine Advanced Configuration.Pipeline Status
When you view the details of an engine in the Engines view, Control Hub displays the list of pipelines currently running on the engine.
Control Hub displays both draft pipelines started from draft runs and published pipelines started from jobs.
Unresponsive Engines
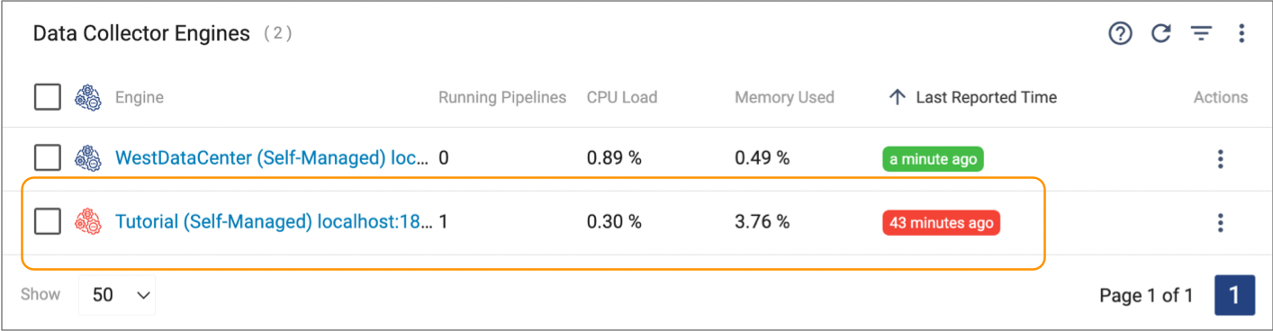
When you view the details of an engine in the Engines view, you can monitor the last time that the engine reported a heartbeat to Control Hub.
Engines communicate with Control Hub at regular one minute intervals to report a heartbeat and the status of running pipelines. If an engine fails to communicate with Control Hub before the maximum engine heartbeat interval expires, then Control Hub considers the engine unresponsive.
The Engines view displays a red Last Reported Time value for unresponsive engines. For example, in the following image, the Tutorial engine is unresponsive:
For more information about unresponsive engines including how Control Hub handles currently active jobs on unresponsive engines, see Jobs and Unresponsive Engines.
Stopping all Draft Runs
When you view the details of an engine in the Engines view, you can stop all draft runs currently running on the engine.
Stop a draft run when you want to stop processing data for the draft pipeline. When you stop a draft run, the job automatically created for the draft run stops the pipeline and then transitions to an inactive status.
When stopping a draft run, Control Hub waits for the pipeline to gracefully complete all tasks for the in-progress batch. In some situations, this can take several minutes.
For example, if a scripting processor includes code with a timed wait, Control Hub waits for the scripting processor to complete its task. Then, Control Hub waits for the rest of the pipeline to complete all tasks before stopping the pipeline.
When you stop a draft run that includes an origin that can be reset, Control Hub maintains the last-saved offset.
- Click in the Navigation panel.
- Click an engine type tab.
- Click an engine link to monitor the engine.
- Click Stop Draft Runs.
-
In the confirmation dialog box that appears, click
OK.
Depending on the pipeline complexity, the draft run might take some time to stop.
- Click Close.
Configuration Properties
When you view the details of an engine in the Engines view, click Configuration to view the engine configuration properties.
The Configuration tab displays a read-only view of the properties. You can enter text in the Filter field to filter the properties. For example, you can enter credentialstore to display the credential store properties.
To modify the configuration properties, edit the deployment that manages the engine.
External Resources
When you view the details of an engine in the Engines view, click External Resources to view the external resources available to the engine.
Only users with the Engine Administrator role can access the External Resources tab.
External resources include external files and libraries that an engine requires to run your pipelines. For example, JDBC stages require a JDBC driver to access the database. When you use a JDBC stage, you must make the driver available as an external resource.
When the parent deployment is not configured to use external resources, you can upload external resources to the engine, as needed. When the parent deployment is configured to use an external resource archive, you update the archive file used by the deployment.
For more information, see External Resources.
Logs
- Data Collector
- The Data Collector log,
sdc.log, includes information about the Data Collector engine, such as start-up messages and information about all pipelines running on the engine. - Transformer
- The Transformer log,
transformer.log, provides information about the Transformer engine such as start-up messages. - Transformer for Snowflake
- The Transformer for Snowflake log,
streamflake.log, includes information about the Transformer for Snowflake engine, such as start-up messages and information about all pipelines running on the engine.
Viewing Engine Logs
- Click in the Navigation panel.
- Click an engine type tab, and then click an engine link to view the engine details.
-
Click the Logs tab to view log data.
The Logs tab displays roughly 50,000 characters of the most recent log information.
-
To filter the messages by log level, select a level from the
Severity list.
By default, the log displays messages for all severity levels.
- To view earlier messages, click Load Previous Logs.
-
To download the latest log file when the web browser uses direct engine REST APIs,
click Download. To download a specific log file, click .
The most recent information is in the file with the highest number.Note: At this time, you cannot download engine logs when the web browser uses WebSocket tunneling to communicate with engines.
Log Format
- Timestamp
- Pipeline
- Severity
- Message
- Category
- User
- Runner
- Thread
IBM StreamSets engines use the Apache Log4j library to write log data. The Log4j version depends on the following engine versions:
- Data Collector or Transformer 5.x and later, all versions of Transformer for Snowflake
- Uses Log4j 2.17.2. The log format is defined for the deployment that manages the engine.
- Data Collector or Transformer 4.x
- Uses Log4j 1.x. The log format is defined for the deployment that manages the engine.
%X{s-entity}- Pipeline name and ID%X{s-runner}- Runner ID%X{s-stage}- Stage name%X{s-user}- User who initiated the operation
Modifying the Log Level
If the engine log does not provide enough troubleshooting information, you can edit the deployment to modify the log level to display messages at another severity level.
- TRACE
- DEBUG
- INFO (Default)
- WARN
- ERROR
- FATAL
- In the Control Hub Navigation panel, click .
-
In the Actions column of the deployment, click the
More icon (
 ) and then click
Edit.
) and then click
Edit.
- In the Edit Deployment dialog box, expand the Configure Deployment section.
- Click Click here to configure next to the Advanced Configuration property.
-
Click Log4j2.
Control Hub displays the log configuration.
-
Modify the configuration based on the following engine versions:
- Data Collector or Transformer 5.x and later, all versions of Transformer for Snowflake - Set the
logger.l1.levelproperty to the log level that you want to use.For example, to set the log level to DEBUG, modify the property as follows:
logger.l1.level=DEBUG - Data Collector or Transformer 4.x - Set the
log4j.logger.com.streamsetsproperty to the log level that you want to use.For example, to set the log level to DEBUG, modify the property as follows:
log4j.logger.com.streamsets=DEBUG
- Data Collector or Transformer 5.x and later, all versions of Transformer for Snowflake - Set the
- Click Save.
- In the Edit Deployment dialog box, click Save.
-
If associated engines are running, click Restart Engines
to restart all engine instances for the changes to take effect.
If associated engines are not running, they inherit the changes when the engines restart.
When you’ve finished troubleshooting, set the log level back to INFO to avoid having verbose log files.
Accessing Engine Log Files
If an engine fails to launch, shuts down unexpectedly, or cannot communicate with Control Hub, you cannot view the engine logs in the Control Hub UI.
- Engine log file
- Standard output generated by the engine installation script
The steps that you use to access the log file and standard output depend on the deployment type that the engine belongs to.
Self-Managed Deployment
To access the log file and standard output for an engine belonging to a self-managed deployment, log in to the machine where the engine is deployed.
Access the information based on the engine installation type:
- Tarball installation
- Locate the log file as follows, based on the engine type:
- Data Collector - /streamsets-sdc-<version>/log/sdc.log
- Transformer - /streamsets-transformer-<version>/log/transformer.log
- Transformer for Snowflake - /streamsets-streamflake-<version>/log/streamflake.log
- Docker installation
- Run the following command to get the container ID for the
engine:
docker ps
Amazon EC2 Deployment
To access the log file and standard output for an engine belonging to an Amazon EC2 deployment, use SSH to connect to the provisioned EC2 instance.
You access the log files differently, based on the deployed engine type and version.
Data Collector 5.11.0 and Later and All Transformer for Snowflake Versions
- Engine log file
- Locate the log file as follows, based on the engine type:
- Data Collector - /logs/sdc.log
- Transformer for Snowflake - /logs/streamflake.log
- Standard output generated by the engine installation script
- Run the following command, where
<engine_type>issdcorstreamflake:sudo journalctl -u <engine_type>
Data Collector 5.10.x and Earlier and All Transformer Versions
- Engine log file
- Locate the log file as follows, based on the engine type:
- Data Collector - /var/log/sdc/sdc.log
- Transformer - /var/log/transformer/transformer.log
- Standard output generated by the engine installation script
- Run the following command, where
<engine_type>issdcortransformer:sudo journalctl -u <engine_type>
Azure VM Deployment
To access the log file and standard output for an engine belonging to an Azure VM deployment, use SSH to connect to the provisioned VM instance.
You access the log files differently, based on the deployed engine type and version.
Data Collector 5.8.0 and Later and Transformer 5.8.0 and Later
- Engine log file
- Locate the sdc.log or transformer.log file in the /logs directory.
- Standard output generated by the engine installation script
- Run the following
command:
sudo journalctl -u sdc
Data Collector 5.7.x and Earlier and Transformer 5.7.x and Earlier
docker ps- Engine log file
- Run the following command to connect to the
container:
docker exec -it <container_ID> bash - Standard output generated by the engine installation script
- Run the following
command:
docker logs <container_ID>
GCE Deployment
To access the log file and standard output for an engine belonging to a GCE deployment, use SSH to connect to the provisioned VM instance.
You access the log files differently, based on the deployed engine type and version.
Data Collector 5.11.0 and Later
- Engine log file
- Locate the sdc.log file in the /logs directory.
- Standard output generated by the engine installation script
- Run the following
command:
sudo journalctl -u sdc
Data Collector 5.10.x and Earlier and All Transformer Versions
- Engine log file
- Locate the log file as follows, based on the engine type:
- Data Collector - /var/log/sdc/sdc.log
- Transformer - /var/log/transformer/transformer.log
- Standard output generated by the engine installation script
- Run the following command, where
<engine_type>issdcortransformer:sudo journalctl -u <engine_type>
Kubernetes Deployment
To access the log file and standard output for an engine belonging to a Control Hub
Kubernetes deployment, use the Kubernetes command-line tool, kubectl,
to access logs for the pod where the engine runs.
First, run the following kubectl command to retrieve the name of each
pod within the Kubernetes namespace where the IBM StreamSets
engines are deployed:
kubectl [-n <namespace_name>] get podsThe IBM StreamSets Kubernetes agent uses the following format to name each provisioned pod:
streamsets-deployment-<Control_Hub_deployment_ID><pod_UID>
After retrieving the appropriate pod name, you can access the following information:
- Engine log file
- Run the following command, where
<engine_type>issdcortransformer:kubectl [-n <namespace_name>] exec --stdin --tty pod/<pod_name> -- cat /logs/<engine_type>.log - Standard output generated by the engine installation script
- Run the following
command:
kubectl [-n <namespace_name>] logs pod/<pod_name>
Metrics
When you view the details of an engine in the Engines view, click Metrics to view metric charts for the engine.
Metric charts include CPU usage, threads, and heap memory usage.
Thread Dump
When you view the details of an engine in the Engines view, click Thread Dump to view all active Java threads used by the engine.
You can sort the list of threads by each column and refresh the list of threads. You can also enter text in the Filter field to filter the results. For example, you can filter the results by thread name or status.
When you expand a thread, Control Hub displays the stack trace for that thread.
Support Bundles
You can generate a support bundle for each engine. A support bundle is a ZIP file that includes engine logs, environment and configuration information, pipeline JSON files, resource files, and other details to help troubleshoot issues.
You upload the generated file to an IBM StreamSets Support ticket, and the Support team can use the information to help resolve your tickets.
When you view the details of an engine in the Engines view, click Support Bundle to generate a support bundle.
Control Hub uses several generators to create a support bundle. Each generator bundles different types of information. You can choose to use all or some of the generators.
Each generator automatically redacts all passwords entered in pipelines, configuration
files, or resource files. The generators replace all passwords with the text
REDACTED in the generated files. You can customize the generators
to redact other sensitive information, such as machine names or user names.
Before uploading a generated ZIP file to a support ticket, we recommend verifying that the file does not include any sensitive information that you do not want to share.
Generators
Control Hub can use the following generators to create a support bundle:
| Generator | Description |
|---|---|
| SDC Info | Includes the following information about the engine:
|
| Pipelines | Includes the following JSON files for each pipeline running on the
engine:
By default, all pipelines are included in the bundle. |
| Blob Store | Internal blob store containing information provided by Control Hub. |
| Logs | Includes the most recent content of the following log files:
|
In addition, Control Hub always generates the following files when you create a support bundle:
metadata.properties- ID and version of the engine that the bundle was generated for.generators.properties- List of generators used for the bundle.
Generating a Support Bundle
When you generate a support bundle, you choose the information to include in the bundle.
You can download the bundle, and then verify its contents and upload it to an IBM StreamSets Support ticket.
- Click in the Navigation panel.
- Click an engine type tab, and then expand an engine details.
- Click View Support Bundle.
- Select the generators that you want to use.
-
Click Download.
Control Hub generates the support bundle and saves it to a ZIP file in your default downloads directory.
You can manually upload the file to a support ticket.
Before sharing the file, verify that the file does not include sensitive information that you do not want to share. For example, you might want to remove the pipelines not associated with your support ticket. By default, the bundle includes all pipelines running on the engine.
Customizing Generators
By default, the generators redact all passwords entered in pipelines, configuration files, or resource files. You can customize the generators to redact other sensitive information, such as machine names or user names.
To customize the generators, modify the support bundle redactor file, support-bundle-redactor.json, located in the etc directory within the engine installation. The file contains rules that the generators use to redact sensitive information. Each rule contains the following information:
- description - Description of the rule.
- trigger - String constant that triggers a redaction. If a line contains this trigger string, then the redaction continues by applying the regular expression specified in the search property.
- search - Regular expression that defines the sub-string to redact.
- replace - String to replace the redacted information with.
{
     "description": "Custom domain names",
     "trigger": ".streamsets.com",
     "search": "[a-z_-]+.streamsets.com",
     "replace": "REDACTED.streamsets.com"
}
Directories
You can view the directories that each engine uses.
When you view the details of an engine in the Engines view, click the Directories tab to view the directories.
| Directory | Includes |
|---|---|
| Runtime | Base directory for engine executables and related files. |
| Configuration | Directory for engine configuration files. Also includes the logj4 properties file. |
| Data | Pipeline configuration and run details. |
| Log | Engine log file, sdc.log, transformer.log, or streamflake.log. |
| Resources | Directory for runtime resource files. |
| Libraries Extra Directory | Directory to store external libraries. |
Health Inspector
When you view the details of a Data Collector engine in the Engines view, click the Health tab to access the Health Inspector.
At this time, the Health Inspector is not available for Transformer engines.
The Data Collector Health Inspector provides a snapshot of how Data Collector is functioning. When you run Health Inspector, it performs checks for common misconfigurations and errors. You can use the Health Inspector to quickly check the health of your Data Collector.
Health Inspector provides only Data Collector-level details. For job or pipeline-level details, monitor the job or review the Data Collector log.
- Data Collector configuration - Displays the settings for certain Data Collector configuration properties, such as the maximum number of pipeline errors allowed in production.
- Java Virtual Machine (JVM) process - Displays the settings for certain JVM configuration properties, such as the maximum amount of memory allotted to the JVM. Also generates related usage statistics, such as the percentage of the JVM memory currently used by Data Collector.
- Machine - Displays important details about available resources on the Data Collector machine, such as the available space in the runtime directory.
- Networking - Verifies that the internet is accessible by pinging the IBM StreamSets website.
Viewing the Health Inspector
Control Hub generates Health Inspector details each time you access the Health tab.
- Click in the Navigation panel.
- Click the Data Collectors tab, and then expand an engine details.
- Click View Engine Configuration, and then click the Health tab.
-
To view all available information, click the Expand All
link.
Green indicates that values are within expected range. Red indicates that values fall beyond the expected range.
Some details, such as JVM Child Processes, provide additional information. To view that information, click Show Output. - To refresh a category of information, click the Rerun link for the category.
- To refresh all Health Inspector details, navigate away from the tab, and then return.
Clearing the runHistory Folder
Data Collector
and Transformer
version 5.0.0 and later store information about previous pipeline runs in a
runHistory folder on the engine machine. If a large number of
pipelines run on the engine, the size of the folder can grow over time. In the rare
occurrence that an engine machine runs out of disk space, you can clear the
runHistory folder.
- Click in the Navigation panel.
- Click an engine type tab, and then click an engine link to view the engine details.
- Click .
- In the confirmation dialog box, click Clear.