Authoring Engine
- Create a connection
- Create a Data Collector or Transformer pipeline or pipeline fragment
- Create a Transformer for Snowflake pipeline or fragment when your organization uses deployed Transformer for Snowflake engines.
When your organization uses the hosted Transformer for Snowflake engine, Control Hub uses the hosted engine as the authoring engine.
The selected authoring engine determines the stages and functionality you can use in the pipeline. For example, the pipeline canvas allows you to add Google stages to a Data Collector pipeline only when the selected Data Collector authoring engine has the Google stage library installed. Similarly, when a new feature is included in the latest Transformer for Snowflake release, the pipeline canvas only displays that feature when you use the latest version of the engine as the deployed authoring engine.
For connections, the selected authoring Data Collector determines the connection types that you can create.
By default, Control Hub selects an accessible engine that you have read permission on and that has the most recent reported time. You can choose a different engine.
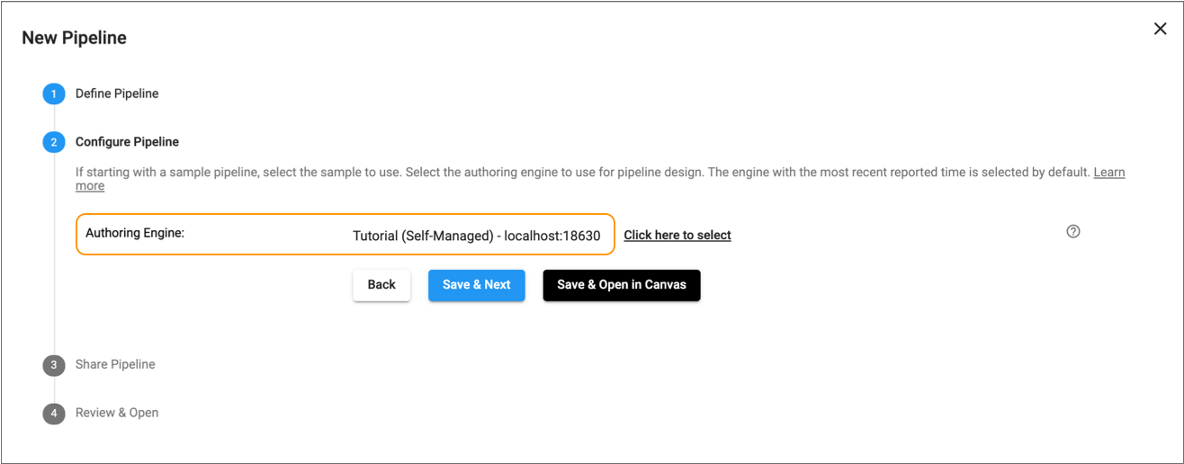
For example, the following image displays the New Pipeline wizard where Control Hub has selected a self-managed authoring engine belonging to the Tutorial deployment:
When you click the link next to the selected engine, Control Hub displays the following authoring engine selection window:
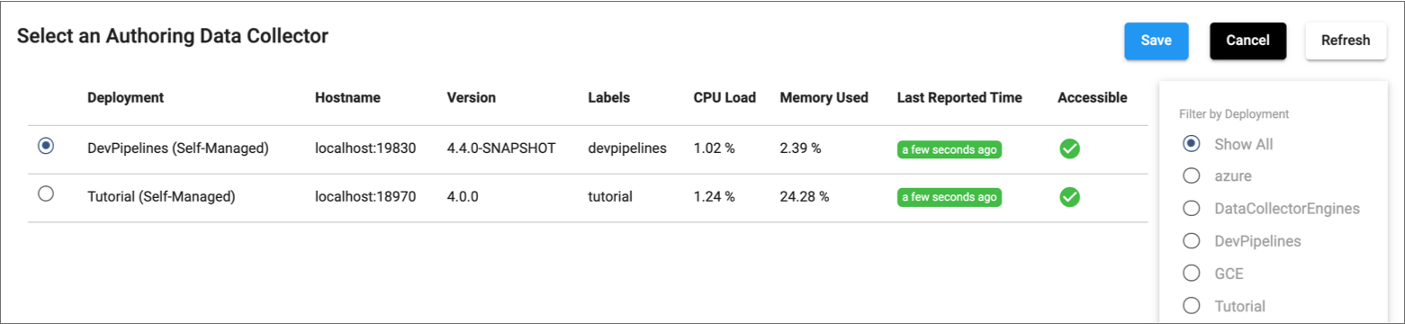
The window displays all engines that you have read permission on. You can filter the list of engines by deployment, version, or label. When a deployment manages multiple engine instances, use the hostname to select a specific engine instance as the authoring engine.
Accessible Engines
You can select any accessible engine as the authoring engine.
- The engine is running, and the engine can communicate with Control Hub.
This is indicated by a green Last Reported Time value in the engine selection window, which displays the last reported time that Control Hub received a heartbeat from the engine.
- The web browser can reach the engine, using either WebSocket
tunneling or direct engine REST
APIs.
This is indicated by a green Accessible check mark in the engine selection window.
The combination of the Last Reported Time and Accessible values indicate whether an engine is accessible. They can have the following possible values:
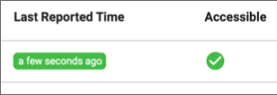
- Both are green
- When both the Last Reported Time and Accessible values are green, the engine
is accessible:
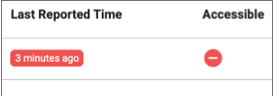
- Both are red
- When both the Last Reported Time and Accessible values are red, the engine
is either not running or cannot communicate with Control Hub due to network
issues:
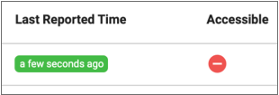
- Last Reported Time is green, but Accessible is red
- When the Last Reported Time value is green, but the Accessible value is red,
the engine is running, but the browser cannot reach the engine:
Changing the Authoring Engine
When you edit a pipeline or fragment in the pipeline canvas, the selected authoring engine determines the stages, stage libraries, and functionality that display in the pipeline canvas.
- Data Collector version 5.4.0 or later
- When using Data Collector version 5.4.0 or later, you can edit pipelines and fragments in the
pipeline canvas when the engine is not accessible. The engine must be
accessible before you can preview, run, validate, or check in the pipeline
or fragment. Note: When using any Data Collector version and the pipeline or fragment includes stages from an Enterprise stage library or a custom stage library, the pipeline canvas displays in read-only mode when the engine is not accessible.
- Earlier Data Collector versions or any Transformer or Transformer for Snowflake version
- When using Data Collector version 5.3.x or earlier or when using any Transformer or Transformer for Snowflake version, the pipeline canvas displays in read-only mode when the engine is not accessible. To edit the pipeline or fragment, you must select another accessible engine.
As you edit a pipeline or fragment in the pipeline canvas, you can change the authoring engine as long as you select the same engine type of the same or later version. For example, when editing a pipeline created with Data Collector version 5.3.0, you can select another Data Collector version 5.3.0 or later. Similarly, when editing a pipeline created with Transformer 5.7.0, you can select another Transformer version 5.7.0 or later.
If you select a later authoring engine version, Control Hub upgrades the pipeline so that it can no longer run on the earlier engine version.
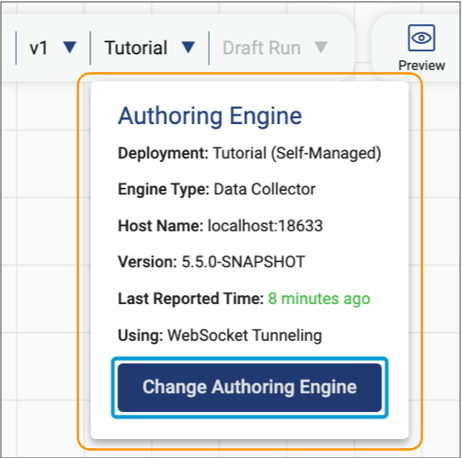
In the top left corner of the pipeline canvas, Control Hub displays the name of the parent deployment that the currently selected authoring engine belongs to. Click the down arrow next to the deployment name to view which authoring engine is being used and to optionally change the engine.
For example, the following image shows the currently selected authoring Data Collector that belongs to the Tutorial deployment:
Stage Libraries
The selected authoring engine determines the stage libraries that are installed and available for use as you design those pipelines and pipeline fragments.
Transformer for Snowflake engines include all available stages and credential stores. You cannot configure the stage libraries for Transformer for Snowflake.
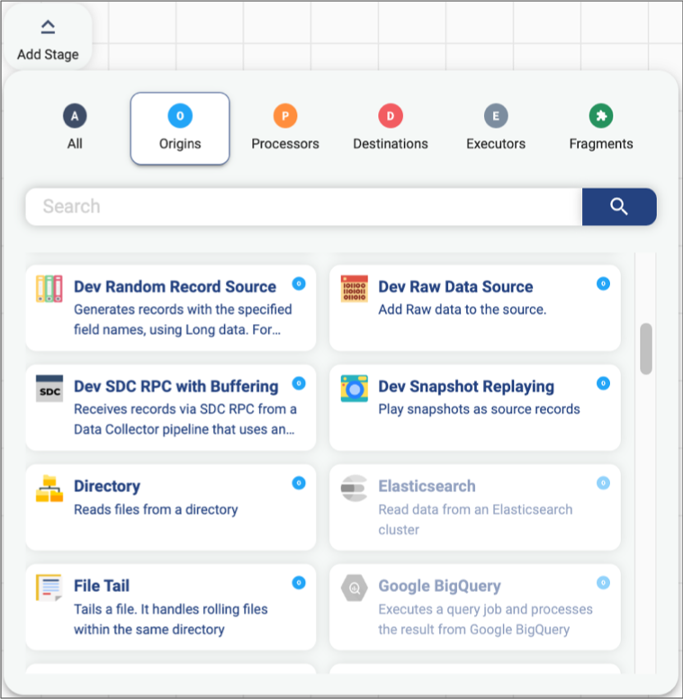
The stage library panel in the pipeline canvas displays all stages. Stages that are not installed on the selected authoring engine appear disabled, or greyed out. For example, the following stage library panel indicates that the Elasticsearch and Google BigQuery origins are not installed:
You can install additional stage libraries, including enterprise stage libraries, from the pipeline canvas. To install an additional stage library, click on a disabled stage. Confirm that you want to install the library, and then restart the engine for the changes to take effect.
External Libraries
The selected authoring Data Collector or Transformer determines the external libraries available to stages as you design pipelines and pipeline fragments. For example, some stages, such as most JDBC stages, require installing a JDBC driver as an external library on Data Collector or Transformer.
Transformer for Snowflake engines do not require access to external libraries.
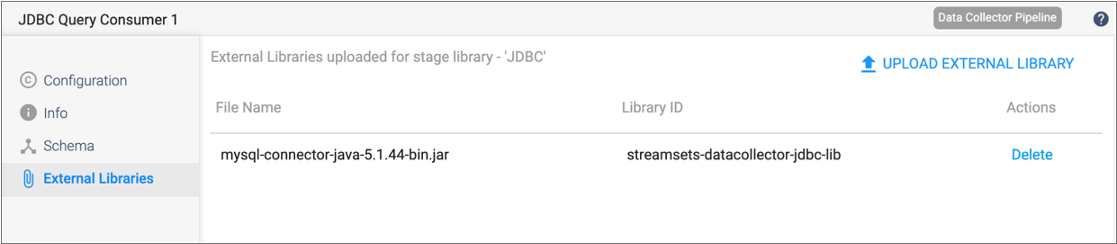
As you design Data Collector or Transformer pipelines, each stage requiring an external library displays the currently installed libraries in the External Libraries tab in the stage properties panel.
For example, the following image shows that a MySQL JDBC driver is installed for the JDBC stage library on the selected authoring Data Collector. As a result, this external library is available to the JDBC Query Consumer origin during pipeline design:
When the parent deployment is not configured to use external resources, you can install an additional external library from the pipeline canvas by clicking Upload External Library from the External Libraries tab. When the parent deployment is configured to use an external resource archive, you update the archive file to install additional libraries. For more information, see External Resources.