Previewing Pipelines and Fragments
You can preview data to help build or fine-tune a pipeline or fragment.
When you preview data, you can see how source data passes through the pipeline or fragment, allowing you to review how each stage changes the data. You can edit stage properties and run the preview again to see how your changes affect the data flow.
You can preview data for one stage at a time or for a group of stages. You can view the data in list or table view and refresh the preview data.
When previewing data for processors, you can determine the order that output records are displayed in.
In general, a preview works the same for all engine types - Data Collector, Transformer, and Transformer for Snowflake. However, there are some behavior differences for each type.
Preview Availability
The Preview icon (![]() ) becomes active when data preview is available.
) becomes active when data preview is available.
- Data Collector and Transformer
- You can preview data under the following conditions:
- All stages in the canvas are connected.
You can preview both complete and incomplete pipelines and fragments, as long as the origin and all processors in the canvas are connected. You do not have to add a destination.
- All required properties are defined.
You can enter any valid value for required properties, even if they are not the final values that you intend to use.
- All stages in the canvas are connected.
- Transformer for Snowflake
- You can preview data under the following conditions:
-
At least one origin is configured for the pipeline.
You can preview both complete and incomplete pipelines and fragments, as long as each origin in the pipeline is correctly configured.
The pipeline can include disconnected stages or a branch that is not connected to an origin, however stages that are not connected to an origin cannot provide preview data.
- Required connection properties are defined:
The Snowflake URL, Warehouse, and Pipeline Working Schema properties must be defined. If the Role property is not defined, preview uses the Public role.
- When your organization uses the hosted Transformer for Snowflake engine, which is the default, the properties are defined in the Snowflake settings in your IBM StreamSets account. You can override those values in individual pipelines.
- When your organization uses deployed engines, connection information is defined in Snowflake connections. You select the connection to use in the pipeline, and you can override connection values as needed.
- Required properties are defined for stages
included in the preview.
You can enter any valid value for required properties, even if they are not the final values that you intend to use. If configured properties generate an error, preview provides data for the stages up to the error-generating stage.
Unconnected stages do not need to be configured.
- Preview is enabled at the organizational level.
By default, preview is enabled for your organization. To protect your Snowflake data, preview can be disabled when the organization uses the hosted engine. You cannot disable preview when your organization uses deployed engines.
-
List View
To display preview data in list view, click the List View icon:
![]() . List view displays output data for origins, both input and output data
for processors, and input data for destinations.
. List view displays output data for origins, both input and output data
for processors, and input data for destinations.
In list view, the preview uses codes and formatting to highlight different types of data and changed data.
By default when you preview a Data Collector pipeline or fragment, the data displays in list view.
Preview Codes
In list view, the preview displays different colors for different types of data and uses formatting to highlight changed fields.
| Preview Code | Description |
|---|---|
| Black values | Date data |
| Blue values | Numeric data |
| Green values | String data |
| Red values | Boolean data |
| Light red background | Fields removed by a stage |
Table View
To display preview data in table view, click the Table View icon:
![]() . By default, table view displays output data for origins
and processors and input data for destinations.
. By default, table view displays output data for origins
and processors and input data for destinations.
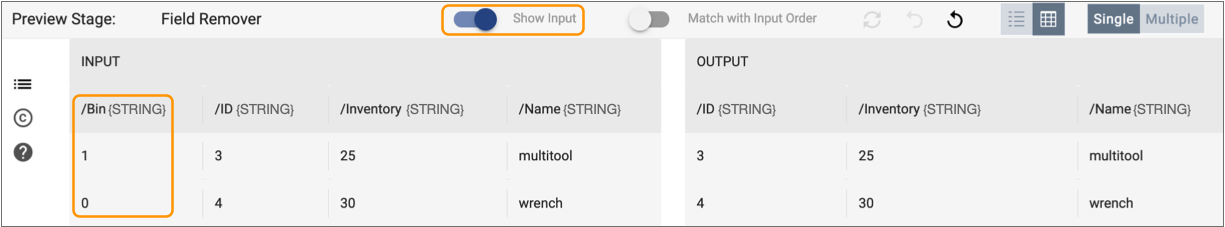
To display both input and output data for processors in table view, select a processor in the canvas, and then toggle the Show Input switch. You might want to display both input and output data when a processor updates the data.
For example, let's say that you configure a Field Remover processor to remove the Bin field. When you display both input and output data in table view, the preview displays the Bin field in the input data only, as follows:
By default when you preview a Transformer or Transformer for Snowflake pipeline or fragment, the data displays in table view.
Preview Data Types
Preview displays data types differently, depending on the following engine types:
- Data Collector
- Preview displays Data Collector data types.
- Transformer
- Preview displays generic data types, such as Boolean, String, and List. These data types represent the Spark data types that are being used. For example, in preview, List represents the Array Spark data type, and Map can represent either the Map or Struct Spark data types.
- Transformer for Snowflake
- Preview displays Snowflake data types.
For all engine types, preview displays date, datetime, and time data using the default
format of the browser locale. For example, if the browser uses the en_US locale, preview
displays dates using the following format: MMM d, y h:mm:ss a.
Preview displays date, datetime, and time data using the time zone that you select in the preview configuration. By default, data preview displays data using the browser time zone.
Processor Output Order
When previewing data for a processor in list or table view, you can preview both the input and the output data. You can display the output records in the order that corresponds with the input records or in the order produced by the processor. The preview displays the most logical choice by default, but you can change the view as needed.
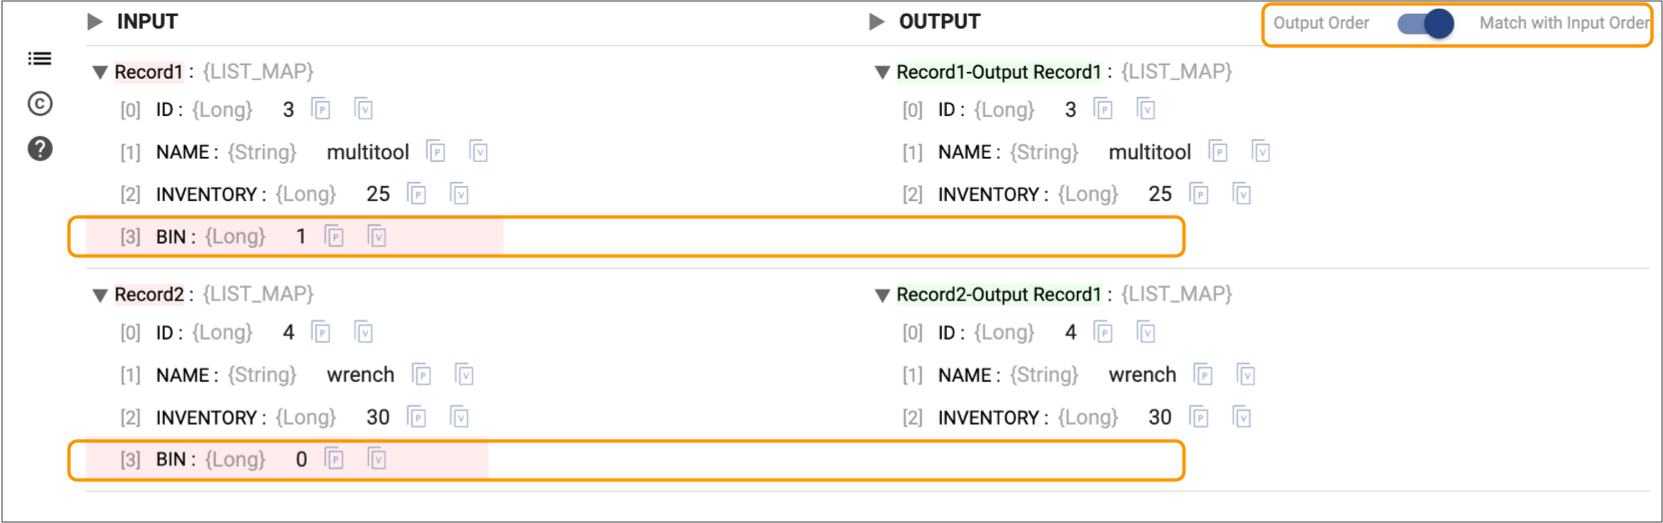
In most cases when you preview data for a processor, you want to compare input and output records side by side because the processor updates the records. For example, when you preview data for a Field Remover processor, the preview displays corresponding input and output records. The preview panel highlights the changed field in each record, as follows:
Some processors such as the Transformer or Transformer for Snowflake Aggregate processor don’t update records – they create new records. And other processors such as the Transformer or Transformer for Snowflake Sort processor reorder the records. In these cases, comparing matching input and output records isn’t relevant. It's more helpful to display the output records in the order produced by the processor.
To change the preview display order in list view, toggle the Output Order / Match with Input Order switch.
To change the preview display order in table view, enable the Show Input switch and then toggle the Match with Input Order switch.
Input and Output Schema for Stages
After running preview for a pipeline or fragment, you can view the input and output schema for each stage on the Schema tab in the properties panel. The schema includes each field path and data type.
- Invoke expression completion for a stage property.
- Click the Select Fields Using Preview Data icon to open the Field Selector dialog box for a stage property.
If you change the schema, for example if you remove a field, rename a field, or change the data type of a field, then you must run preview again so that the schema reflects the change.
In most cases as you configure stage properties, you can use expression completion or the Field Selector dialog box to specify a field path. However, in some cases, you might use the Schema tab to copy a field path.
For example, let’s say you are configuring a Field Type Converter processor for a Data Collector
pipeline to convert the data type of a field by name. After running preview, you select
the Field Type Converter in the pipeline canvas, and then click the Schema tab in the
pipeline properties panel. You click the Copy Field Path to
Clipboard icon (![]() ) to copy the field path from the Schema tab, and then paste
the field path into the processor configuration.
) to copy the field path from the Schema tab, and then paste
the field path into the processor configuration.
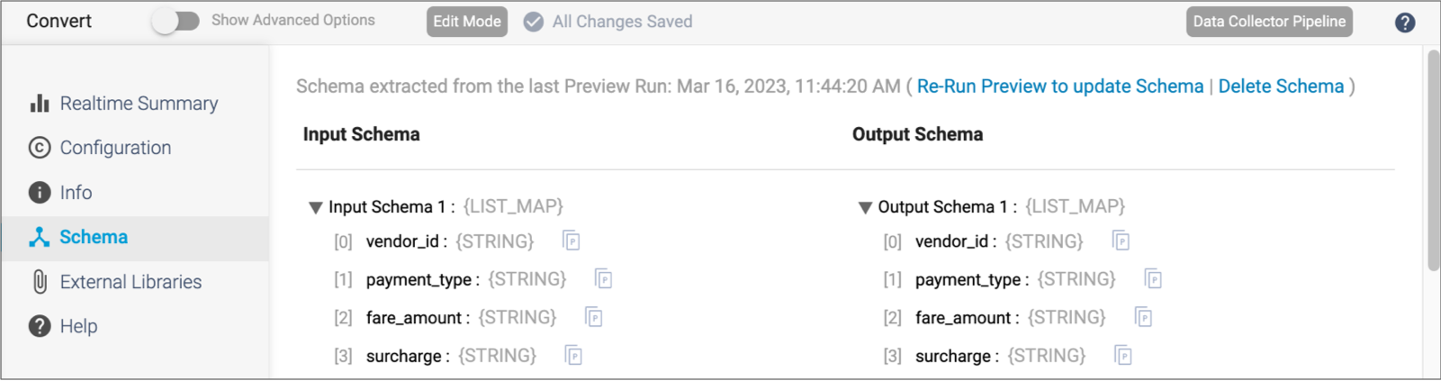
The following image displays a sample Schema tab with the time of the last data preview:
Preview for Data Collector
When you preview a Data Collector pipeline or fragment, you can choose from several options to provide source data for the preview. You can also edit preview data to test and tune the processing logic.
Source Data
- Data from the origin - Use available data from the origin.
- Data from the test origin - Use data from the test origin configured in the
pipeline or fragment properties.
For more information about test origins in pipelines and fragments, see Test Origin for Preview in the Data Collector documentation.
- Data from a snapshot - Use snapshot data from the same pipeline, another pipeline, or from an active job. Available for pipelines only.
Additional Information
- Oracle CDC pipelines - When previewing a pipeline with the Oracle CDC origin,
preview generates a maximum of 10 records, ignoring the Preview Batch Size
property when set to a higher value.
Also, preview allows up to 5 seconds for the origin to receive records, which starts after connecting to Oracle. As a result, when previewing a pipeline with an Oracle CDC origin, preview ignores the configured Preview Timeout property when set to a higher value.
- Oracle CDC Client pipelines - Due to the complex nature of the Oracle CDC Client
origin, initiating preview can take longer than expected. If preview times out,
try increasing the Preview Timeout property incrementally to allow the origin
time to connect.
Also, to generate more than one preview record, set the Max Batch Wait Time property for the origin to a value greater than 0.
- Whole file data format - When previewing a pipeline or fragment that processes whole file data, data preview displays only one record.
Editing Preview Data
For Data Collector pipelines and fragments, you can edit preview data to view how a stage or group of stages processes the changed data. Edit preview data to test for data conditions that might not appear in the preview data set.
For example, when the stage filters integer data based on an expression, you might change the input data to test positive and negative integer values, as well as zero.
- The output data column for an origin.
- The input data column for processors.
When you edit preview data, you can pass the changed data through the pipeline or fragment, or you can revert your changes to return to the original data.
-
To change field values while running preview, in the Output
Data column of an origin or the Input Data
column for all other stages, click the value that you want to change and enter a
new value.
You can edit values for any input data. Edited values display in italics.
-
To process changed data, click the Run With Changes
icon:
 .
This runs the data preview with the current set of data and stage configuration.In the Input Data column, records with changed values display with an asterisk and the changed values are highlighted. The Output Data column displays the results of processing. You can change and process preview data as often as necessary.
.
This runs the data preview with the current set of data and stage configuration.In the Input Data column, records with changed values display with an asterisk and the changed values are highlighted. The Output Data column displays the results of processing. You can change and process preview data as often as necessary.
Preview for Transformer
When previewing Transformer data, you can choose to preview using Spark libraries embedded in the Transformer installation or using the Spark cluster configured for the pipeline.
Spark for Preview
When you preview Transformer data, you can choose the Spark libraries used to run the preview:
- Embedded Spark libraries
- Transformer includes embedded Spark libraries that you can use to preview a local or cluster pipeline.
- Spark cluster configured for the pipeline
- Preview communicates with the Spark cluster configured for the pipeline.
In most cases, you'll want to preview using the configured Spark cluster so that preview uses the same processing as when you run the pipeline. However, if you want to quickly test processing logic that doesn't require using the source data from the origin, you can use development origins and then preview using the embedded Spark libraries.
By default, a preview of Transformer data uses the configured Spark cluster. To change the Spark used for preview, modify the preview configuration.
Preview for Transformer for Snowflake
When previewing Transformer for Snowflake data, you can choose whether to limit the stage input to the data from upstream stages.
Also note that the Preview Timeout property is not honored when you preview Transformer for Snowflake pipelines.
Providing Preview Data
- Input limited by preview batch size and upstream stages
- By default the Limit Stage Input property is enabled, and preview provides
data as follows:
- Pipeline origins provide data up to the number of rows configured for the Preview Batch Size property, based on availability in pipeline sources.
- Each non-origin stage receives input data only from upstream
stages:
- When a stage, such as a SQL Query processor, increases the number of rows, preview limits the rows based on the configured preview batch size.
- When a stage, such as a Filter or Join processor, reduces the number of rows, the reduced number of rows is what downstream stages receive.
- Input guided by the preview batch size
- When pipeline processing reduces preview data to a point where you cannot see how stages process data, you might first increase the preview batch size to increase the preview data set. If this still results in an insufficient number of rows, try disabling the Limit Stage Input preview property.
Writing to Destinations and Executors
Since data preview is a tool for development, by default, it does not write data to destination systems or display the expected output for destinations. You can, however, view the data that is passed to a destination stage, which is typically similar to what is written to destination systems.
For a preview of Data Collector data, preview also does not pass data to executors in the pipeline, by default.
If you like, you can configure the preview to write data to destination systems. When previewing Data Collector data, writing to destinations also enables passing data to executors, which triggers their actions. For example, you might enable passing data to an executor to verify that it performs the configured task as expected.
- For Data Collector pipelines, select Write to Destinations and Executors
- For Transformer and Transformer for Snowflake pipelines, select Write to Destinations
Previewing a Pipeline or Fragment
Preview a pipeline or fragment to review the values for each record to determine if the processing logic transforms data as expected.
When you start preview, Control Hub uses the last-saved preview configuration for the pipeline or fragment version.
-
In the toolbar above the pipeline canvas, click the
Preview icon:
 . Then, click Run
Preview.
Alternatively, you can use one of the following keyboard shortcuts:
. Then, click Run
Preview.
Alternatively, you can use one of the following keyboard shortcuts:- Command+Return on Mac
- Ctrl-Enter on Windows
Note: To protect your Snowflake data, data preview can be disabled at an organizational level. When disabled at an organizational level, you cannot preview Transformer for Snowflake pipelines or fragments.If your organization allows data preview and the Preview icon is unavailable, check the Validation Errors list for unconnected stages and required properties that are not defined. For more information, see Preview Availability.
The preview panel highlights the origin stage and displays preview data.
-
To view preview data in table view, click the Table View
icon:
 .
.
By default, table view displays only output data for processors. To display both output and input data for processors, toggle the Show Input switch.
-
To view preview data in list view, click the List View icon:
 .
.
For information about the preview codes, see List View.
-
To change the display order of output records for processors, toggle the
Match with Input Order switch.
For more information, see Processor Output Order.
- To view data for the next stage, select the stage in the pipeline canvas.
-
To preview data for multiple stages, click
Multiple.
The canvas highlights the first selected stage in green and the last stage in red, displaying data for the selected group of stages.
- To change the first stage in the group, select the current first stage and then select the desired stage.
- To change the last stage in the group, select the current last stage and then select the desired stage.
-
To expand the preview panel, click the Expand icon:
 .
.
-
To refresh the preview, click the Reload Preview icon:
 .
Refreshing the preview provides a new set of data.
.
Refreshing the preview provides a new set of data. - To exit the preview, click Close Preview.
Modifying the Preview Configuration
Preview uses a default configuration to preview a pipeline or fragment. You can modify the preview configuration properties when viewing or previewing a pipeline or fragment.
The changes that you make are saved for the version of the pipeline or fragment that you are working with.
-
To start preview, use one of the following steps:
- When viewing the pipeline, click the Preview
icon: . Then, click Configure
Preview.
- When previewing the pipeline, click the Preview
Configuration icon:
 .
.
- When viewing the pipeline, click the Preview
icon:
-
In the Preview Configuration dialog box, configure the
following properties.
The properties that display depend on the type of data processed by the pipeline or fragment:
Preview Property Description Preview Source Source data for the preview: - Configured Source - Provides data from the origin system.
- Test Origin - Provides data from the test origin configured for the pipeline or fragment.
- Snapshot Data - Uses available snapshot data. Available for pipelines only.
Available for Data Collector data only.
Snapshot Data When using a snapshot for source data, select the snapshot to use. Available for Data Collector data only.
Preview Using Spark to use for the preview: - Embedded Spark libraries - Previews all pipelines using the embedded Spark libraries included in the Transformer installation.
- Configured cluster manager - Previews cluster pipelines using the Spark cluster configured for the pipeline. Previews local pipelines using the local Spark installation on the Transformer machine.
Available for Transformer data only.
Preview Batch Size Number of records to use in the preview. For Data Collector and Transformer pipelines and fragments, honors values up to the maximum preview batch size defined in the engine configuration properties.
Default is 10.
Preview Timeout Milliseconds to wait for preview data. Use to limit the time data preview waits for data to arrive at the origin. Relevant for transient origins only. This property is not used by Transformer for Snowflake.
Run Preview Through Stage Previews the pipeline or fragment up to the selected stage. Use to perform a partial preview when one of the stages encounters an error.
For example, if preview fails because a processor encounters an error, you might run the preview up to the stage preceding the processor. Then you can view the preview data and update the processor configuration as needed.
By default, previews all stages.
Time Zone Time zone used to display date, datetime, or time data. Default is the browser time zone.
Write to Destinations Determines whether the preview passes data to destinations. Available for Transformer and Transformer for Snowflake data only.
Write to Destinations and Executors Determines whether the preview writes data to destination systems and passes data to executors in the pipeline, triggering their actions in external systems. By default, does not write data to destination systems or pass data to executors in the pipeline.
Available for Data Collector data only.
Execute Pipeline Lifecycle Events Triggers the generation of any appropriate pipeline events, typically the Start event. If the event is configured to be used, event consumption is also triggered. Available for Data Collector data only.
Show Record/Field Header Displays record header attributes and field attributes in list view. Attributes do not display in table view. Show Field Type Displays the data type for fields. Save Preview Record Schema Determines whether the preview record schema is saved in the pipeline or fragment configuration. By default, the schema is not saved. When you close and then reopen the pipeline or fragment, the Schema tab for each stage is empty. You must run preview again to update the input and output schema.
When selected, the schema is saved after the pipeline or fragment is closed. However, be aware that saving the schema can cause the pipeline or fragment configuration to reach an excessive size, which in turn can cause a publish or export of the pipeline or fragment to fail.
Available for Data Collector and Transformer data only.
Limit Stage Input Limits stage input to data from upstream stages and applies the preview batch size as an output limit.
When enabled, non-origin stages receive data passed from upstream stages. The property is enabled by default.
When disabled, non-origin stages can receive preview data that was not passed from upstream stages when upstream data has been reduced and the data is available.
Available for Transformer for Snowflake data only.
- Click Run Preview to run preview and save your changes.
Editing Stage Properties
When running a preview, you can edit stage properties to see how the changes affect preview data. For example, you might edit the condition in a Stream Selector processor to see how the condition alters which records pass to the different output streams.
When you edit properties, you can test the change by refreshing the preview data.
-
To edit stage properties while running a preview, select the stage you want to
edit and click the Stage Configuration icon (
 ) in the preview panel.
- Change properties as needed.
-
To test the changed properties, click the Reload Preview
icon: .
This refreshes the preview data.
- To revert your change, manually change the property back.