Try IBM StreamSets
This tutorial covers the steps needed to try IBM StreamSets. Although the tutorial provides a simple use case, keep in mind that IBM StreamSets enables you to build, run, and monitor large numbers of complex pipelines.
- IBM StreamSets as a Service
- Use the following URL to sign up for a free trial: https://cloud.login.streamsets.com/signup
- IBM StreamSets as client-managed software
- An administrator must install the IBM StreamSets service on IBM Software Hub and give you access to the service. To determine whether the service is installed, open the Services catalog and check whether the service is Installed, Ready to use.
Build a Pipeline
Build a pipeline to define how data flows from origin to destination systems and how the data is processed along the way.
This tutorial builds a pipeline that reads a sample CSV file from an HTTP resource URL, processes the data to convert the data type of several fields, and then writes the data to a JSON file on your local machine.
The sample CSV file includes some invalid data, so you'll also see how errors are handled when you preview the pipeline.
- Log in to IBM StreamSets.
- In the top right toolbar, click .
-
In the Select Engine dialog box, click Skip
& Use Latest Version.
A blank pipeline named New Pipeline <date> opens in the canvas.
- In the canvas, click the Add Origin icon to open the stage selector.
-
Enter http in the search field, and then select the HTTP
Client origin, as follows:
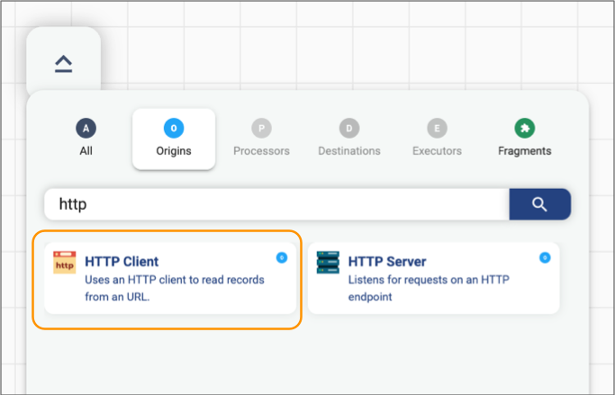
The origin is added to the canvas.
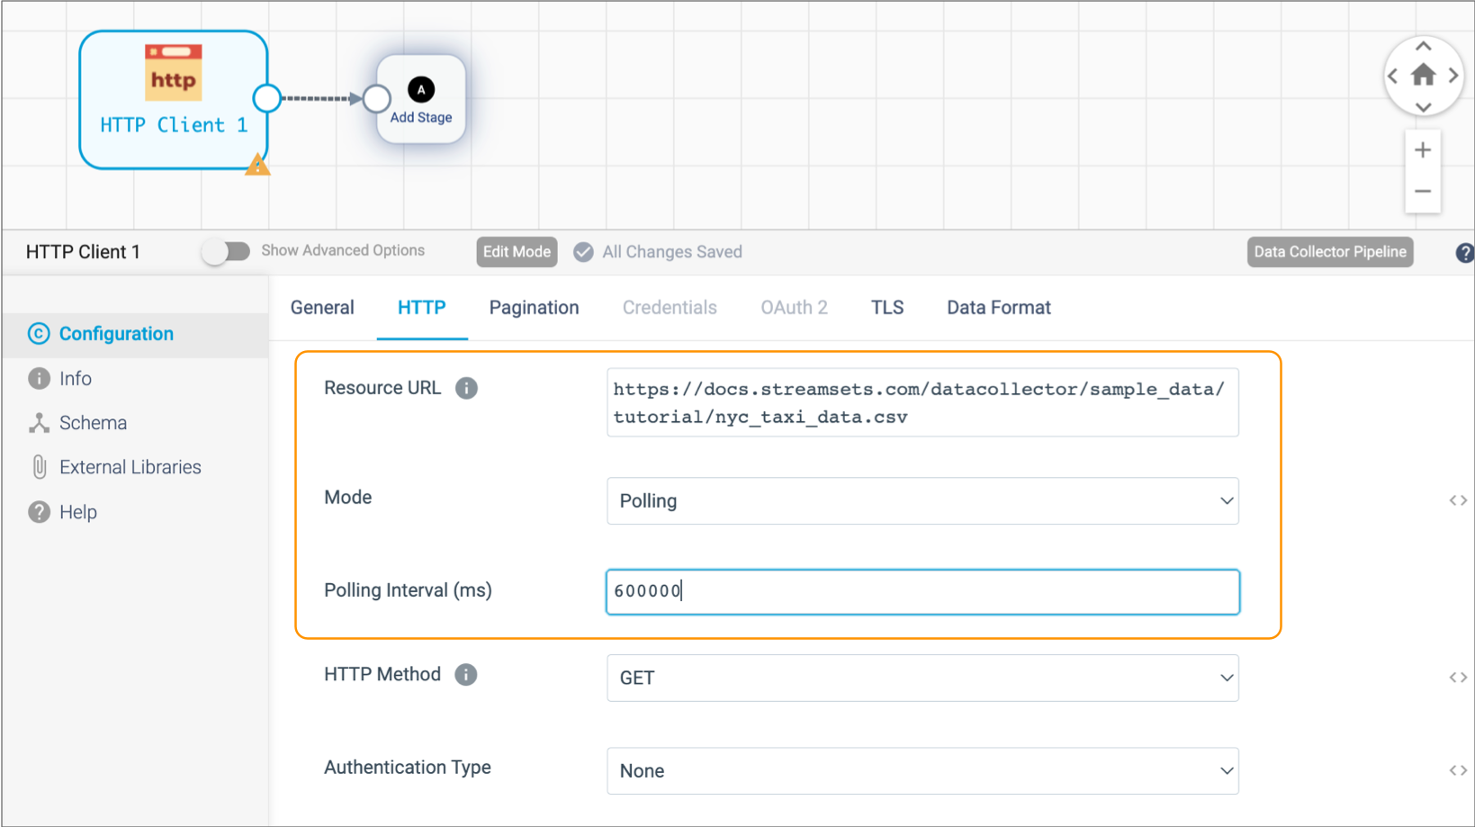
- In the properties panel below the canvas, click the HTTP tab.
-
Configure the HTTP properties as follows:
HTTP Property Value Resource URL https://docs.streamsets.com/datacollector/sample_data/tutorial/nyc_taxi_data.csvMode Polling Polling Interval 600000 Note: In most cases you would use batch mode to configure the origin to read a single file. In batch mode, the origin processes all available data and then stops the pipeline and job. However, when the origin uses batch mode to read a small amount of data, the Data Collector engine runs and stops the pipeline before you have a chance to monitor the data in real time. Setting the mode to polling with a 10 minute (or 600000 milliseconds) interval causes the origin to read the full contents of the file, wait 10 minutes, and then read the contents of the file again. -
Use the default values for the remaining properties.
The HTTP tab should be configured as follows:
- Click the Data Format tab.
- For the Data Format property, select Delimited.
- Click Show Advanced Options, and then for the Header Line property, select With Header Line.
-
Use the default values for the remaining properties.
Since the sample data is read from a file, the origin reads all fields as String. So, next you'll add a Field Type Converter processor to the pipeline to convert several datetime fields to the Datetime data type.
- Click the Add Stage icon to open the stage selector.
- Click Processors, enter type in the search field, and then select the Field Type Converter processor.
-
On the Conversions tab, convert fields with datetime
data to Datetime as follows:
Conversion Property Value Conversion Method By Field Name Fields to Convert - /dropoff_datetime
- /pickup_datetime
Note: To reference a field, you enter the path of the field. For simple records of data such as the sample CSV file, you reference a field as follows:/<field name>.Convert to Type Datetime Date Format yyyy-MM-dd HH:mm:ss Now that you've built part of the pipeline, you can preview the pipeline to view several records of source data. However, before previewing your first pipeline, you must deploy an IBM StreamSets engine.
Deploy an Engine
IBM StreamSets allows you to unlock your data without ceding control. Deploy a Data Collector engine to your local machine to maintain all ownership and control of your data.
-
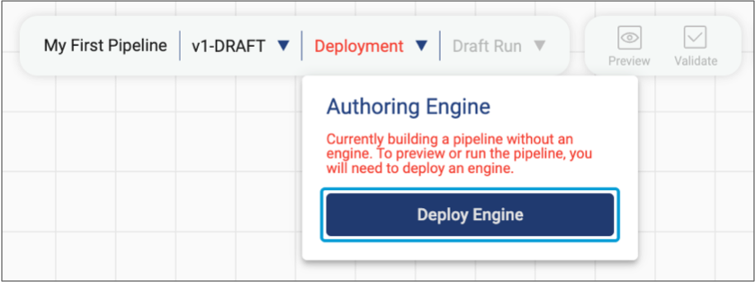
In the toolbar above the pipeline canvas, click
Deployment, and then click Deploy
Engine, as follows:
 Note: If you have already deployed an engine or have access to an engine deployed by another user in your organization, then the pipeline canvas displays the name of the deployment rather than Deployment. You can skip these steps and continue with Preview the Pipeline.
 -
In the Deploy an Engine dialog box, deploy the engine in
one of the following ways:
- Run a Docker image - As the easiest way to get started, most users like to deploy an engine using Docker. Download and install Docker Desktop, and then deploy the engine in a Docker container.
- Download and install from a script - Advanced users might prefer to take full control of setting up a machine. Run an installation script that downloads and extracts a tarball file on your machine, and then deploys the engine so that it runs locally on the machine.
Run a Docker Image
Compatible for most operating systems.
-
Download and install Docker Desktop.
On most operating systems, Docker Desktop starts automatically after installation.
On Windows, you must start Docker Desktop.
- Open a command prompt or terminal.
-
Click the Copy to Clipboard icon (
 )
next to the generated command.
)
next to the generated command.
-
At the command prompt, paste and then run the copied command.
When the Deploy an Engine dialog box indicates that the engine has successfully started, click Use Engine.
For more help with engine installation, try these troubleshooting tips.
Download and Install from a Script
Not compatible with Windows. Windows users must run a Docker image.
- Open a command prompt or terminal.
-
Run the following command to set the file descriptors limit required by Data Collector:
ulimit -n 32768Note: This command sets the file descriptors limit in the current command prompt or terminal only. To retain the limits after relaunching, see the Data Collector documentation. -
Run the following command to check if Java 8, Java 11, or Java 17 is
installed:
java -versionIf none of these Java versions is installed, we recommend downloading and installing OpenJDK 17. Use the Eclipse Temurin installation instructions for your operating system, macOS or Linux.
-
Click the Copy to Clipboard icon ()
next to the generated command.
- At the command prompt, paste and then run the copied command.
-
Respond to the command prompts to enter download and installation
directories.
When the Deploy an Engine dialog box indicates that the engine has successfully started, click Use Engine.
For more help with engine installation, try these troubleshooting tips.
Troubleshooting
Use the following troubleshooting tips for help with deploying an engine:
- When I run the command to deploy an engine, I get the following error:
-
Could not resolve host: na01.hub.streamsets.com - When I run the Docker command to deploy an engine on Linux, I get the following error:
-
permission denied while trying to connect to the Docker daemon socket - When I run the Docker command to deploy an engine on Windows, I get the following error:
-
Error: error during connect: this error may indicate that the docker daemon is not running - When I run the Docker command to deploy an engine on Windows, I get the following error:
-
Error: error during connect: in the default daemon configuration on Windows, the docker client must be run with elevated privileges to connect - When I try to start Docker Desktop on Windows, I receive a message that Docker Desktop requires a newer WSL kernel version.
- On some Windows machines, you must update the WSL kernel to the latest version before you can start Docker Desktop.
Preview the Pipeline
Now that you've deployed an engine, you can preview the pipeline.
-
In the toolbar above the pipeline canvas, click the
Preview icon:
 .
.
When you preview the pipeline, you can view several records of source data.
The HTTP Client origin is selected in the pipeline canvas, and preview displays several records of output data read by the origin. Since this is the origin of the pipeline, no input data displays.
Notice how the Field Type Converter processor displays a red square with a counter of 1, indicating that the stage has encountered an error.
-
Select the Field Type Converter processor in the canvas.
Preview highlights the first record in red and displays an error message indicating that the first record has an unparsable date. The date data includes invalid characters at the end, as follows:
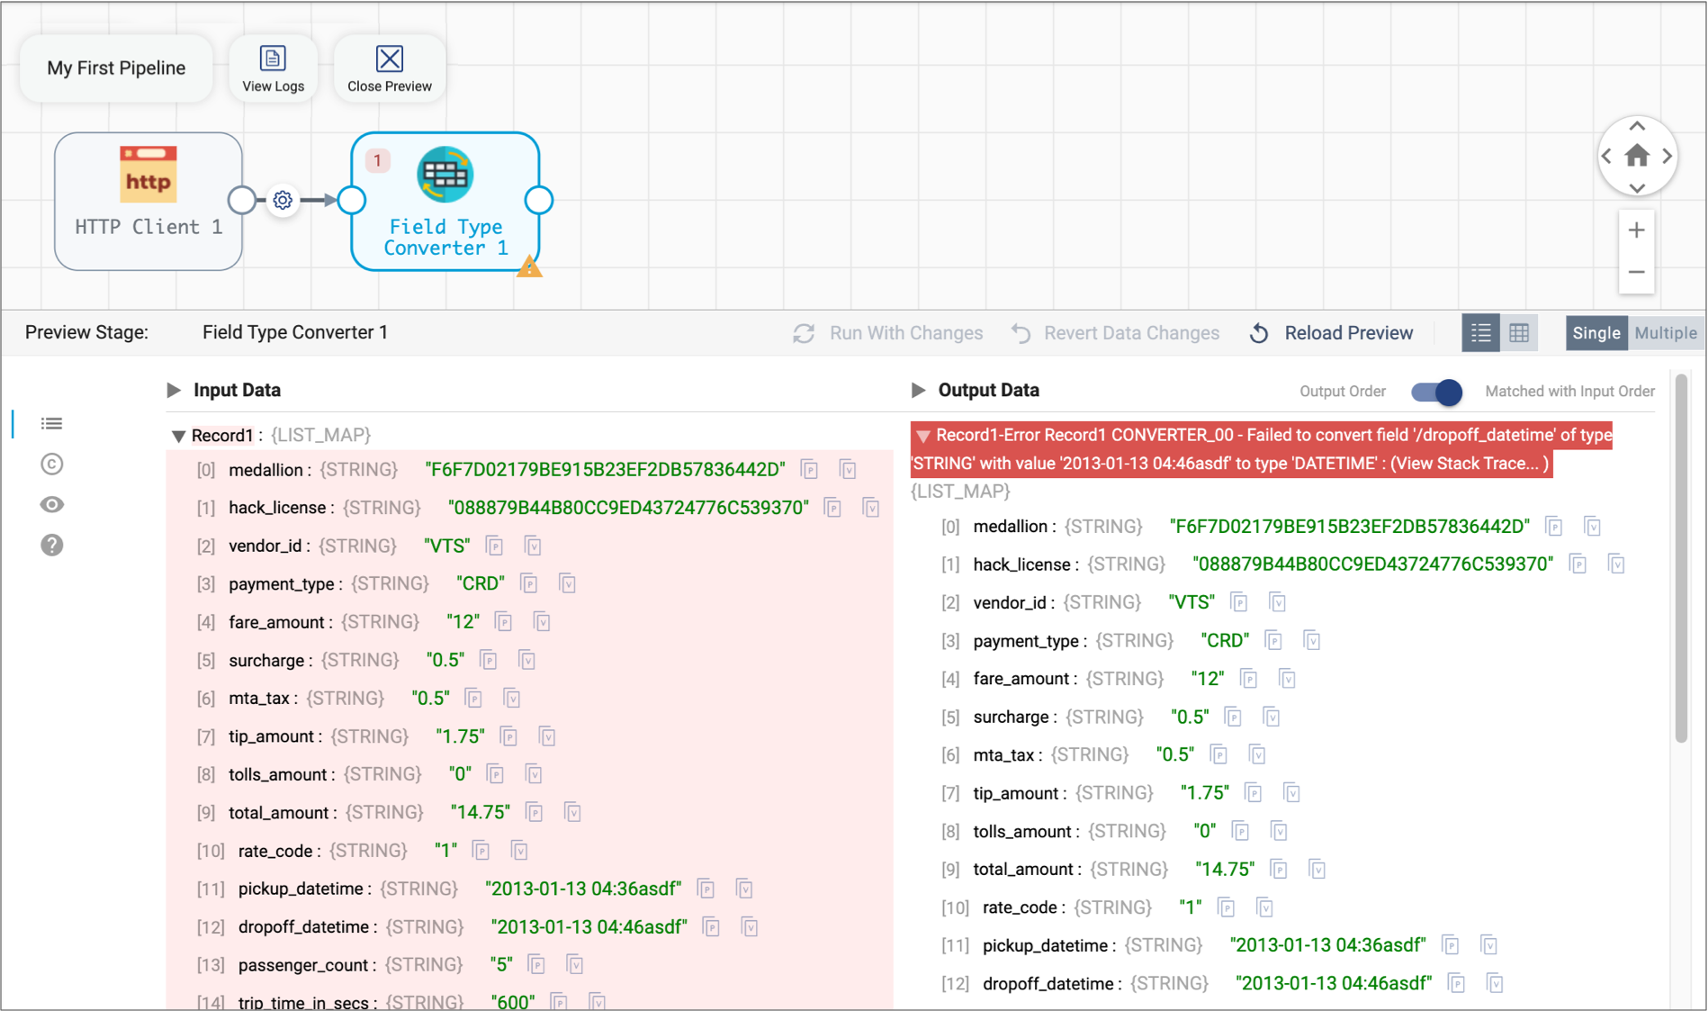
By default, the stage passes error records to the pipeline for error handling, and then the pipeline discards the error records. Since this is sample data, you can leave the default error record handling. When you run the pipeline, this first record will not be passed to the next stage for processing.
-
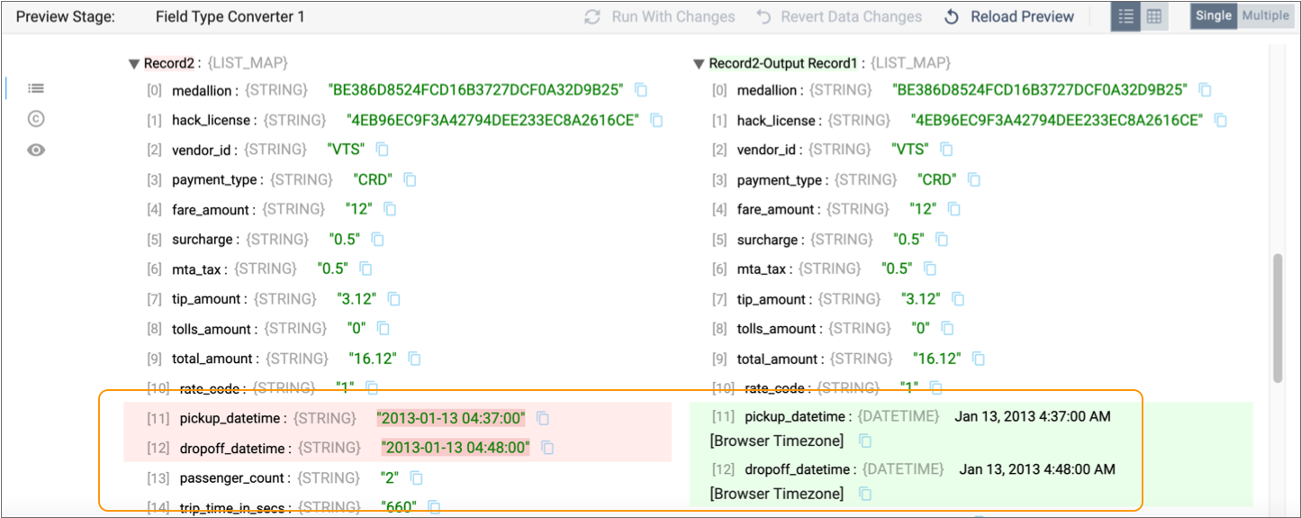
With the processor still selected in the canvas, scroll down in the preview
panel to display the input and output data of the second record.
You can see that the date fields in the second record were successfully converted to the Datetime data type:
- Click Close Preview to close the preview.
- Click the Add Stage icon to open the stage selector.
-
Enter local in the search field, and then select the
Local FS destination.
The Local FS destination writes to files in a local file system.
-
Click the Output Files tab, and configure the following
property.
Use the defaults for the advanced options:
Output Files Property Description Directory Template By default, the directory template includes datetime variables to create a directory structure for output files. This is intended for writing large volumes of data. Since you are only processing the sample file, you don't need the datetime variables. Go ahead and delete the default and enter a local directory where you want the files to be written.
For example:
/<base directory>/tutorial/destination -
Click the Data Format tab, and select
JSON to write the data using the JSON format.
Use the defaults for the remaining properties.
Run a Job
Next, you'll check in the pipeline to indicate that your design is complete and the pipeline is ready to be added to a job and run. When you check in a pipeline, you enter a commit message. IBM StreamSets maintains the commit history of each pipeline.
Jobs are the execution of the dataflow. Jobs enable you to manage and orchestrate large scale dataflows that run across multiple engines.
Since this pipeline processes one file, there's no need to enable the job to start on multiple engines or to increase the number of pipeline instances that run for the job. As a result, you can simply use the default values when creating the job. As you continue to use IBM StreamSets, you can explore how to run pipelines at scale.
-
With the pipeline open in the canvas, click the Check In
icon:
 .
.
-
Enter a commit message. For now, you can simply use the default message.
As a best practice, state what changed in this pipeline version so that you can track the commit history of the pipeline.
-
Click Publish & Next.
The Share Pipeline step displays. You can skip this step for now. When additional users join your organization, you must share the pipeline to grant them access to it.
-
Click Save & Create New Job.
The Create Job Instances wizard appears.
- Use the defaults in the Define Job step, and click Next.
- In the Select Pipeline step, click Next.
- Use the defaults in the Configure Job step, and click Save & Next.
-
Click Start & Monitor Job.
The job displays in the canvas, and Control Hub indicates that the job is active.
Monitor the Job
Next, you'll monitor the progress of the job. When you start a job, Control Hub sends the pipeline to the Data Collector engine deployed to your local machine. The engine runs the pipeline, sending status updates and metrics back to Control Hub.
-
As the job runs, click the Realtime Summary tab in the
monitor panel to view the real-time statistics for the job:
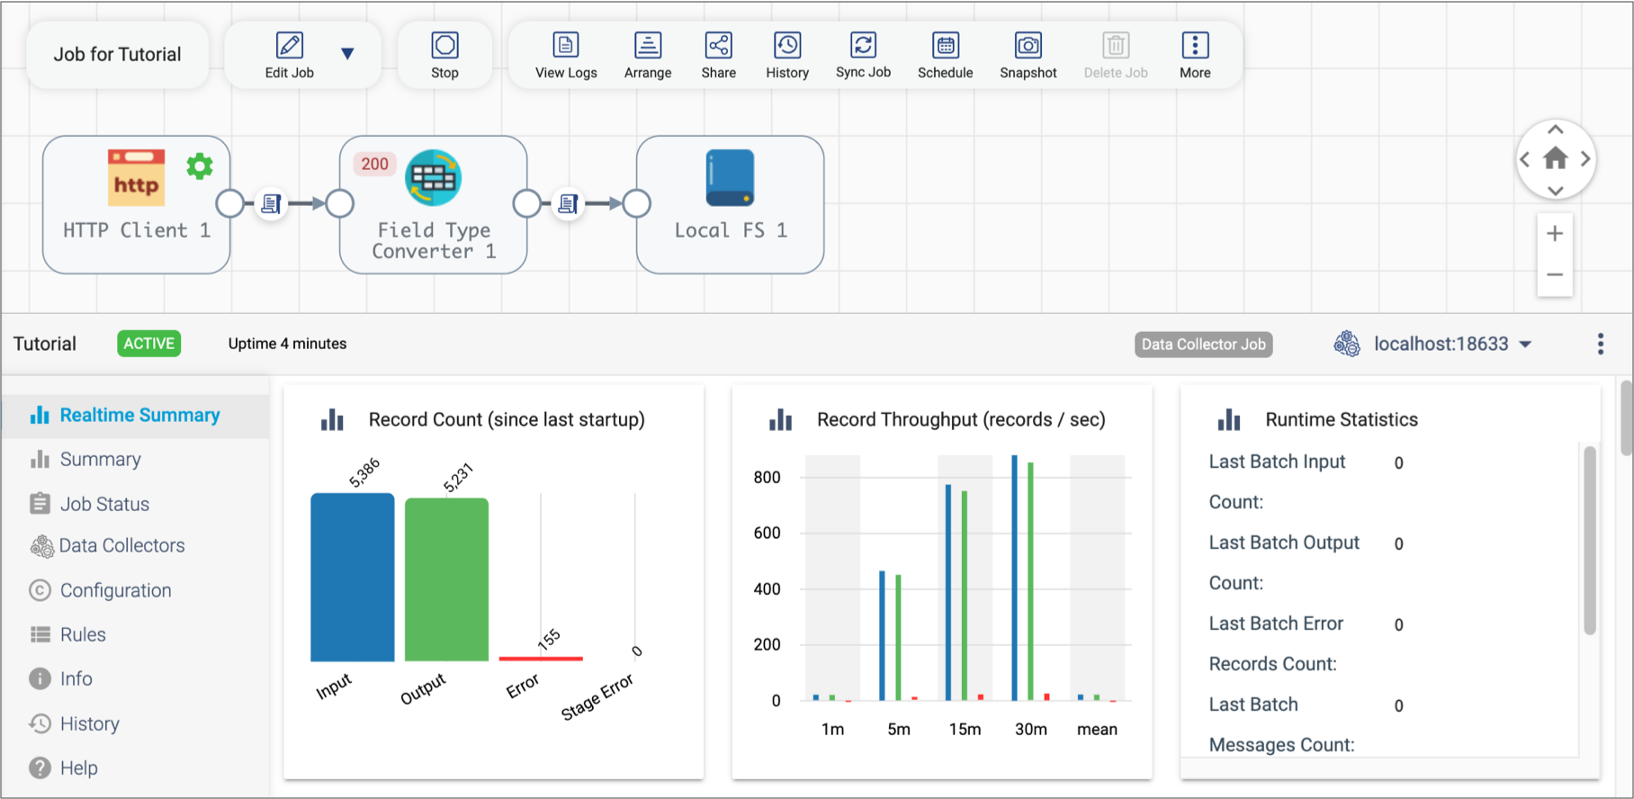
Notice how the Record Count chart displays more input records than output records. That's because the pipeline is configured to discard the error records encountered by the Field Type Converter processor.
-
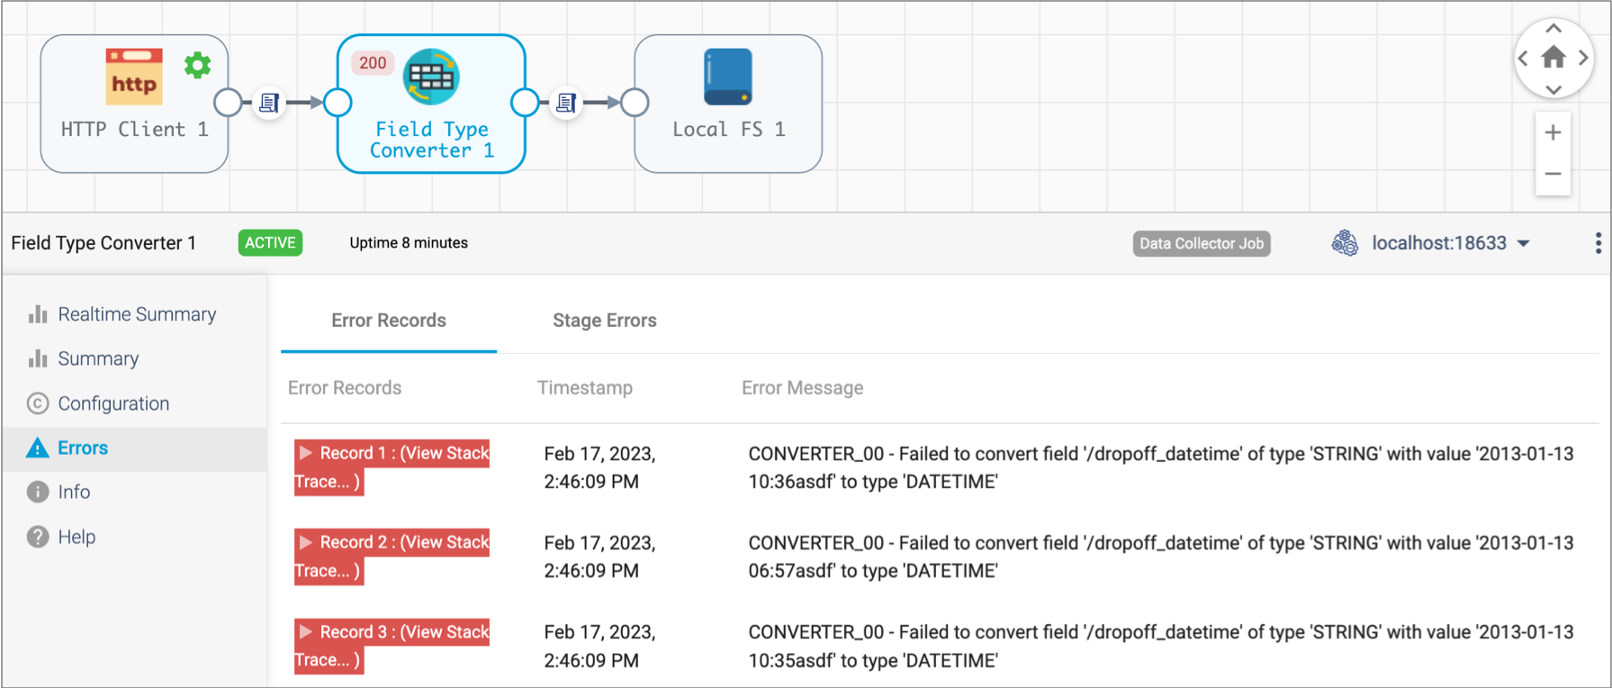
Select the Field Type Converter processor in the canvas, and then click the
Errors tab.
The tab displays an error message for each error record, as follows:
-
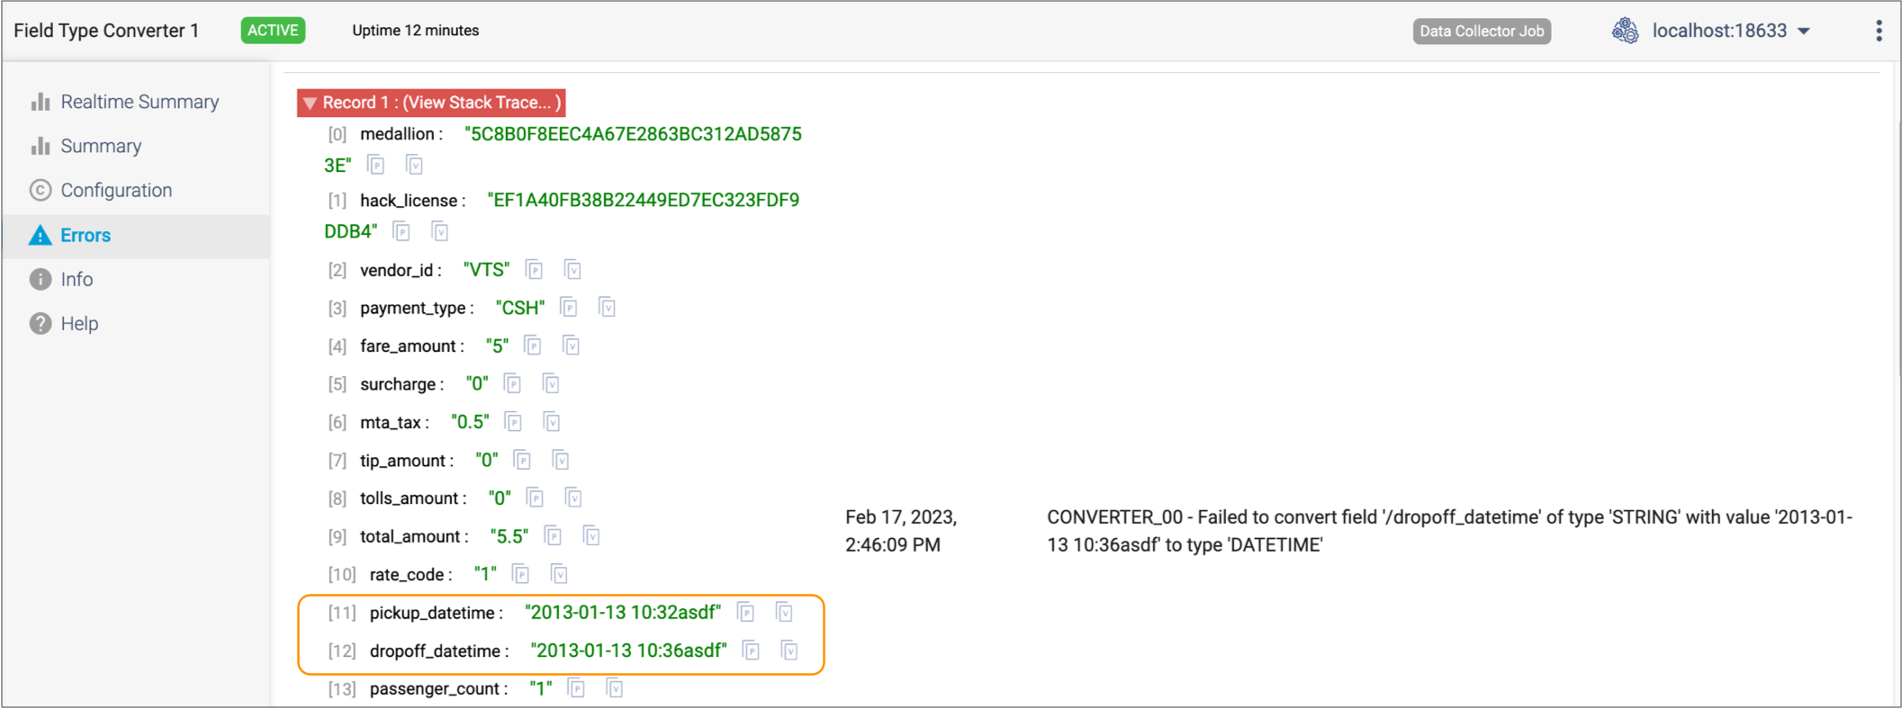
Expand one of the error records, and you'll see the same invalid data causing
the error that you saw during the preview of the pipeline, as follows:
Notice how the HTTP Client origin has displayed the running icon (
 )
for the last several minutes although the input record count has not
increased. That's because you configured the origin to poll the specified
URL every 10 minutes. So the origin waits for that interval, then reads the
file again.
)
for the last several minutes although the input record count has not
increased. That's because you configured the origin to poll the specified
URL every 10 minutes. So the origin waits for that interval, then reads the
file again.When you've finished monitoring the data, stop the job so that the pipeline doesn't run indefinitely.
-
Click the Stop icon:
 .
The Confirmation dialog box appears.
.
The Confirmation dialog box appears. -
To stop the job, click OK.
The job transitions from a deactivating to an inactive state.
- After the job successfully stops, click Close.
-
Locate the local directory configured for the destination,
/<base
                        directory>/tutorial/destination
, and open the file to verify that the data was written in JSON format.
Next Steps
- Invite others to join
- Invite other users to join your organization and collaboratively manage pipelines as a team.
- Modify your first pipeline
- Modify your first pipeline to add a different Data Collector destination to write to another external system. You can also add additional processors to explore the other types of processing available with Data Collector pipelines.
- Complete a more detailed tutorial
- Complete a more detailed Data Collector pipeline design tutorial to learn about additional processors, how a pipeline can process data in two branches, and how to use data rules to raise an alert during pipeline processing.
- Explore sample pipelines
- Explore the sample pipelines included with Control Hub.
- Explore engines
-
- Compare the IBM StreamSets engines - learn about their differences and similarities.
- Set up and deploy an engine in your cloud service provider account, including Amazon Web Services (AWS) or Google Cloud Platform (GCP).
- Learn how engines communicate with Control Hub to securely process your data.
- Explore team-based features
-
- Learn how teams of data engineers can use Control Hub to collaboratively build pipelines. Control Hub provides full lifecycle management of the pipelines, allowing you to track the version history and giving you full control of the evolving development process.
- To create a multitenant environment within your organization, create groups of users. Grant roles to these groups and share objects within the groups to grant each group access to the appropriate objects.
- Use connections to limit the number of users that need to know the security credentials for external systems. Connections also provide reusability - you create a connection once and then other users can reuse that connection in multiple pipelines.
- Use job templates to hide the complexity of job details from business analysts.
- Explore advanced features
-
- Use topologies to map multiple related jobs into a single view. A topology provides interactive end-to-end views of data as it traverses multiple pipelines.
- Create a subscription to listen for Control Hub events and then complete an action when those events occur. For example, you can create a subscription that sends a message to a Slack channel or emails an administrator each time a job status changes.
- Create a sequence to run a collection of jobs in sequenced order based on conditions.
- Schedule a job to start or stop on a weekly or monthly basis.