Monitoring Data Collectors
When you view registered Data Collectors in the Execute view, you can monitor the performance of each Data Collector and the pipelines currently running on each Data Collector.
You can view configuration properties, all active Java threads, metric charts, logs, and directories for each Data Collector. You can also generate a support bundle with the information required to troubleshoot various issues with the engine. And you can view information about the basic health of each Data Collector.
To monitor a Data Collector, simply expand the Data Collector details in the view.
To display most monitoring details, the web browser must be able to access the execution Data Collector.
Performance
When you view the details of a Data Collector version 3.4.0 or later in the Execute view, you can monitor the performance of the Data Collector.
Control Hub does not display performance information for earlier versions of Data Collector.
- CPU Load
- Percentage of CPU being used by the Data Collector.
- Memory Used
- Amount of memory being used by the Data Collector out of the total amount of memory allocated to that Data Collector.
You can sort the list of Data Collectors by the CPU load or by the memory usage so that you can easily determine which Data Collectors are using the most resources.
You can also analyze historical time series charts for the CPU load and memory usage. For example, you can view the performance information for the last hour or for the last seven days.
The following image displays the location where you select a time period for analysis of the charts:
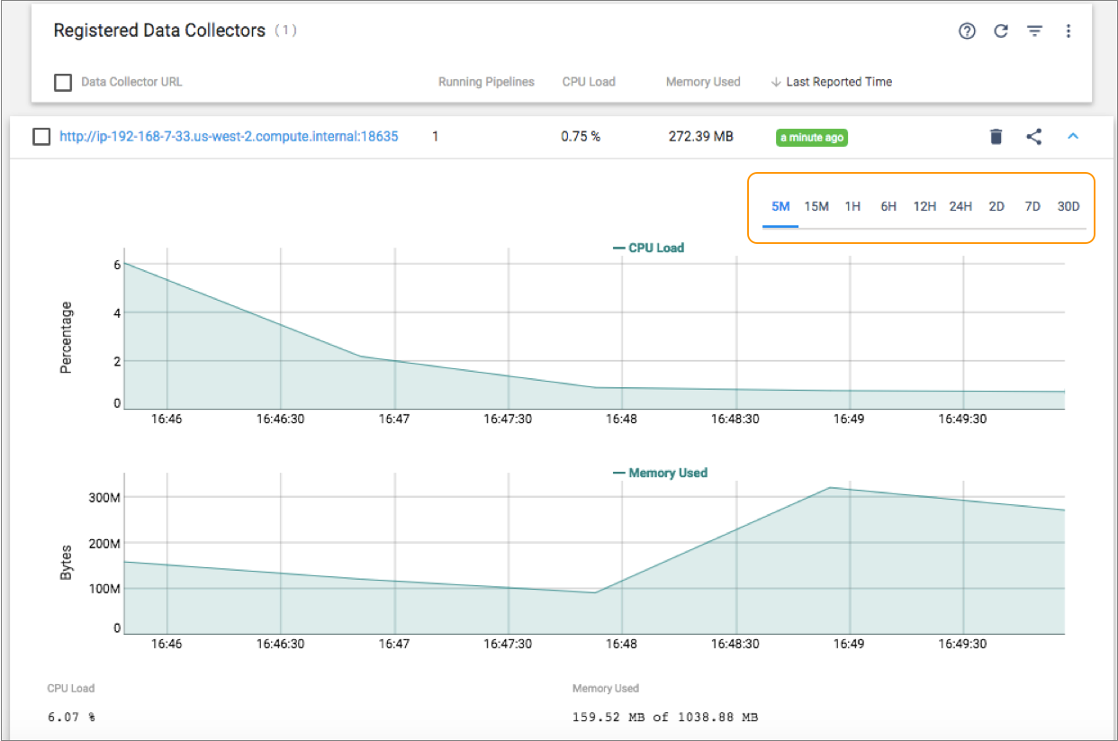
By default, registered Data Collectors
send the CPU load and memory usage to Control Hub
every minute. You can change the frequency with which each Data Collector
sends this information to Control Hub by
modifying the dpm.remote.control.status.events.interval property in the
Control Hub configuration
file, $SDC_CONF/dpm.properties.
Configuration Properties
When you view the details of a Data Collector in the Execute view, click View Engine Configuration to view the Data Collector configuration properties.
$SDC_CONF/sdc.properties file and the
following additional files:dpm.propertiesvault.propertiescredential-stores.properties
You can enter text in the Filter field to filter the properties. For example, you can
enter dpm to display the properties included in the
dpm.properties file.
For details about the configuration properties or to edit the configuration files, see Data Collector Configuration in the Data Collector documentation.
Metrics
When you view the details of a Data Collector in the Execute view, click View Engine Metrics to view metric charts for the Data Collector.
Metric charts include CPU usage, threads, and the number of pipeline runners in the thread pool.
Thread Dump
When you view the details of a Data Collector in the Execute view, click View Thread Dump to view all active Java threads used by the Data Collector.
You can sort the list of threads by each column and refresh the list of threads. You can also enter text in the Filter field to filter the results. For example, you can filter the results by thread name or status.
When you expand a thread, Control Hub displays the stack trace for that thread.
Support Bundles
When you view the details of a Data Collector in the Execute view, click View Support Bundle to generate a support bundle.
A support bundle is a ZIP file that includes Data Collector logs, environment and configuration information, pipeline JSON files, resource files, and other details to help troubleshoot issues. You upload the generated file to a StreamSets Support ticket, and the Support team can use the information to help resolve your tickets. Alternatively, you can send the file to another StreamSets community member.
For more information about generating a support bundle, including the generators used to create the bundle and how to customize the generators, see Support Bundles in the Data Collector documentation.
Viewing Logs
You can view and download the Data Collector log,
$SDC_LOG/sdc.log, when you monitor a Data Collector. The
Data Collector log
provides information about the Data Collector engine,
such as start-up messages, user logins, or pipeline editing. The log also includes
information about all pipelines running on the engine.
For information about the log format and how to modify the log level, see Log Format in the Data Collector documentation.
-
View the details of a Data Collector in the Execute view, click View Engine Configuration,
and then click the Logs tab to view log data.
The Logs tab displays roughly 50,000 characters of the most recent log information.
-
To filter the messages by log level, select a level from the
Severity list.
By default, the log displays messages for all severity levels.
- To view earlier messages, click Load Previous Logs.
-
To download the latest log file, click Download. To
download a specific log file, click .
The most recent information is in the file with the highest number.
Directories
You can view the directories that each Data Collector uses. You might check the directories being used to access a file in the directory or to increase the amount of available space for a directory.
When you view the details of a Data Collector in the Execute view, click View Engine Configuration, and then click the Directories tab to view the directories.
Data Collector directories are defined in environment variables. For more information, see Environment Configuration in the Data Collector documentation.
| Directory | Includes | Environment Variable |
|---|---|---|
| Runtime | Base directory for Data Collector executables and related files. | SDC_DIST |
| Configuration | The Data Collector configuration file, sdc.properties, and related
realm properties files and keystore files. Also includes the Log4j properties file. |
SDC_CONF |
| Data | Pipeline configuration and run details. | SDC_DATA |
| Log | Data Collector
log file, sdc.log. |
SDC_LOG |
| Resources | Directory for runtime resource files. | SDC_RESOURCES |
| SDC Libraries Extra Directory | Directory to store external libraries. | STREAMSETS_LIBRARIES_EXTRA_DIR |
Health Inspector
When you view the details of a Data Collector version 3.20.x or later in the Execute view, click View Engine Configuration, and then click the Health tab to access the Health Inspector.
The Data Collector Health Inspector provides a snapshot of how Data Collector is functioning. When you run Health Inspector, it performs checks for common misconfigurations and errors. You can use the Health Inspector to quickly check the health of your Data Collector.
For more information about running Health Inspector, see Health Inspector in the Data Collector documentation.
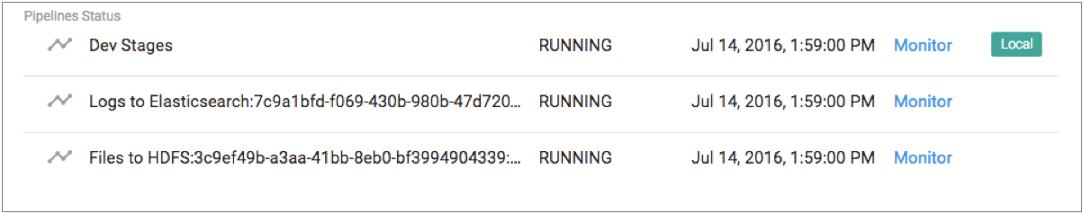
Pipeline Status
When you view the details of a Data Collector in the Execute view, Control Hub displays the list of pipelines currently running on this Data Collector.
Control Hub can display the following types of running pipelines for each Data Collector:
- Local pipelines
- A local pipeline is a test run of a draft pipeline. Local pipelines should only be run on authoring Data Collectors. Use an authoring Data Collector to start, stop, and monitor local pipelines.
- Control Hub controlled pipelines
- A Control Hub controlled pipeline is a pipeline that is managed by Control Hub and run remotely on registered Data Collectors. Control Hub controlled pipelines should only be run on execution Data Collectors. Control Hub controlled pipelines include the following:
- Published pipelines run from Control Hub jobs.
After you publish or import pipelines to Control Hub, you add them to a job, and then start the job. When you start a job on a group of Data Collectors, Control Hub remotely runs an instance of the published pipeline on each Data Collector. Use Control Hub to start, stop, and monitor published pipelines that are run from jobs.
Control Hub uses the following format to name published pipelines:<pipeline name>:<job ID>:<organization ID> - System pipelines run from Control Hub jobs.
Control Hub automatically generates and runs system pipelines to aggregate statistics for jobs. System pipelines collect, aggregate, and push metrics for all of the remote pipeline instances run from a job. When you start a job on a group of Data Collectors, Control Hub picks one Data Collector to run the system pipeline.
Control Hub uses the following format to name system pipelines:System Pipeline for Job <job name>:<system job ID>:<organization ID>Note: Control Hub generates system pipelines as needed. Published pipelines that are not configured to aggregate statistics do not require system pipelines.
- Published pipelines run from Control Hub jobs.
The following image shows the Pipeline Status area for a Data Collector that is currently running a local pipeline and two published pipelines: