Reports
Reports View
The Reports view lists a set of predefined reports that give an overall summary of the system. Use these predefined reports to monitor and troubleshoot jobs.
Click the link to a report to open the report.
- Alerts report
- Displays a list of active and acknowledged data SLA and pipeline alerts. In the Actions column for each listed alert, you can acknowledge the alert or view the job for the alert.
- Jobs in Error State report
- Displays a list of jobs that have a red status, indicating that an error has occurred that must be resolved. In the Actions column for each listed job, you can view the job, job history, job logs, or pipeline included in the job.
- Offline or Unhealthy Engines report
- Displays a list of execution engines that are offline or that are unhealthy because they have exceeded their resource thresholds. In the Actions column for each listed engine, you can view the engine details.
Report Definitions View (deprecated)
The Report Definitions view allows you to define a custom data delivery report that provides data processing metrics for a given job or topology. For example, you can use reports to view the number of records that were processed by a job or topology the previous day.
Data processing metrics are also available when you monitor a job or topology. For example, the detail pane of a topology provides a single view into the record count and throughput for all running pipelines in the topology.
While those monitoring metrics display on demand, data delivery reports provide reporting on those metrics for specified windows of time that you can easily reference at a later date.
You can create periodic and on-demand reports. With periodic reports, Control Hub gathers information at predetermined times. With on-demand reports, you decide when to gather data.
You can also use subscriptions to email a DevOps operator, for example, when reports have been generated and are ready for viewing.
All reports are in PDF format. You can view your reports directly from the Control Hub interface, or download them to your local drive. You can use subscriptions to notify you when a report has been generated and is available for viewing.
Data Delivery Report Contents
Data delivery reports provide statistics related to the specified job or topology for the reporting window.
A report based on a job lists the number of input, output, and error records for the job and for each destination in the pipeline.
A report based on a topology lists the number of input, output, and error records for the topology, for each job in the topology, and for each destination in each pipeline.
Prerequisites
Before you create a data delivery report, note the following prerequisites:
- The user who creates the report must have at least read permission on the job or topology for the report.
- All pipelines included in the report must be configured to write statistics to an
external system. Pipelines cannot be configured to write to Control Hub
or to discard statistics.
You configure a pipeline to write statistics when you design the pipeline.
- All jobs included in the report must have time series analysis enabled.
Enable time series analysis when you configure a job. For more information, see time series analysis.
Absolute and Relative Times
When creating data delivery reports, you define the reporting window from the job or topology. You can use an absolute time or a relative time.
Absolute times are commonly used for on-demand, or one-time reports. You define the exact start and end date and time for when data is retrieved from the job or topology. For example, generate a report for data moved through a job between 6 am on April 23, 2018 and 6 am on April 24, 2018. While you can use absolute times for periodic reports, the report will show the exact same data every time it is generated.
Relative times are commonly used for periodic or recurring reports. A relative time means the reporting window is relative to when you generate the report. For example, generate a report for data moved through a job during the previous 24 hours. Control Hub includes several predefined times, such as last 12 hours, or last 30 minutes.
Or, you can define your own window using the ${time:now()} function. For
example, ${time:now() - 36 * HOURS} or ${time:now() - 90 *
MINUTES}. time:now() refers to the time the report is
generated. You can use DAYS, HOURS, and
MINUTES as the relative time value.
Working with Report Definitions
Each data delivery report has a report definition, which represents the specified job or topology and when data is retrieved from that job or topology.
The Report Definitions view lists all report definitions you have access to.
-
Create report definitions.
-
Edit report definitions.
-
Delete report definitions.
-
Generate a data delivery report.
- View a data delivery report.
Creating Report Definitions
- In the Navigation panel, click .
- Click the Add icon.
- Enter a name and optionally a description.
- Click Next.
- Select how to define the period of time to gather data:
- Absolute
- Relative
- For absolute, enter the start and end time of the data range to use.
- For relative, select a range from the predefined list or enter a start and end
range using the time function
${time:now()}. For more information, see relative times. - Click Next.
- Select the job or topology that you want to generate the report on.
- Click Save.
Generating Data Delivery Reports
To generate your data delivery report, do one of the following:
- For periodic reports, click the Schedule Report icon to open the scheduler.
- For on-demand reports, click the report definition name in the Report Definitions view and then click Generate Report.
Viewing Data Delivery Reports
To view a data delivery report, click the name of the report in the Report Definitions view. The details of the report display. Then click Show Reports.
Control Hub displays a list of all reports generated for that report definition, with the most recent at the top.
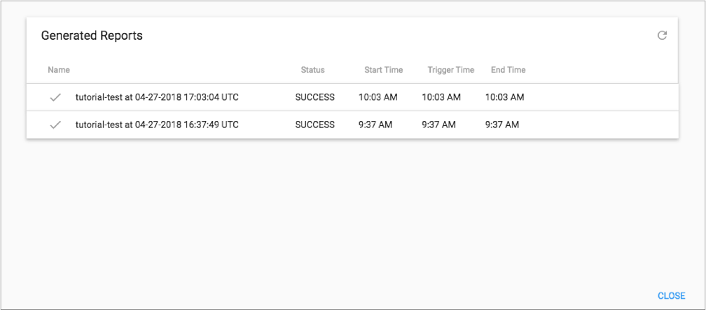
Click the report name to view it, or click the download icon to download it to your local drive.
Troubleshooting
Use the following tips for help with data delivery reports:
- My report contains no data.
-
The job includes a pipeline that is configured to discard statistics or to write them to Control Hub. To generate reports, the pipeline must write statistics to an external system.
- My report failed and the report status has an exclamation point (!).
-
The job has time series analysis disabled. To generate reports, you must configure the job to enable time series analysis.
You can enable time series analysis for an inactive job when you edit the job.