System Metrics
Supported pipeline types:
|
The System Metrics origin reads the metrics from the edge device at regular intervals, based on the amount of delay time between batches that you configure. For example, if you set the delay time to 10 minutes, then the origin creates a new batch containing the selected system metrics every 10 minutes.
Each batch contains a single record that includes the timestamp when the data was read and a map field for each selected system metric type. When you configure the origin, you select the types of system metrics to read - including host information and CPU, memory, disk, network, and process metrics.
For more information about installing SDC Edge, designing edge pipelines, and running and maintaining edge pipelines, see Meet StreamSets Data Collector Edge.
Example
You want to collect, monitor, and analyze the system metrics of all of your edge devices.
You install SDC Edge on each edge device. You use Data Collector to design an edge sending pipeline that includes the System Metrics origin and an HTTP Client destination that posts the system metrics to an HTTP endpoint. You deploy the edge sending pipeline to all of the edge devices and then run the pipeline on each device.
You design a Data Collector receiving pipeline that includes an HTTP Server origin that reads the system metrics posted to the HTTP endpoint. After reading the metrics, the Data Collector receiving pipeline performs additional processing on the data and then writes the data to Elasticsearch for analysis of the metrics. You run the Data Collector receiving pipeline on Data Collector.
Collected System Metrics
The System Metrics origin uses the psutil package for the Go programming language (or Golang) to collect system metrics.
The values that the psutil package for Golang collects vary based on the operating system of the edge device. For a complete list of the metrics that the System Metrics origin collects for each operating system, run preview for the edge pipeline.
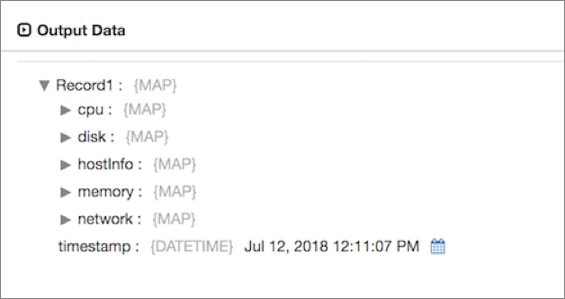
For example, the following image displays preview for a System Metrics origin configured to collect all system metrics types except for process metrics:
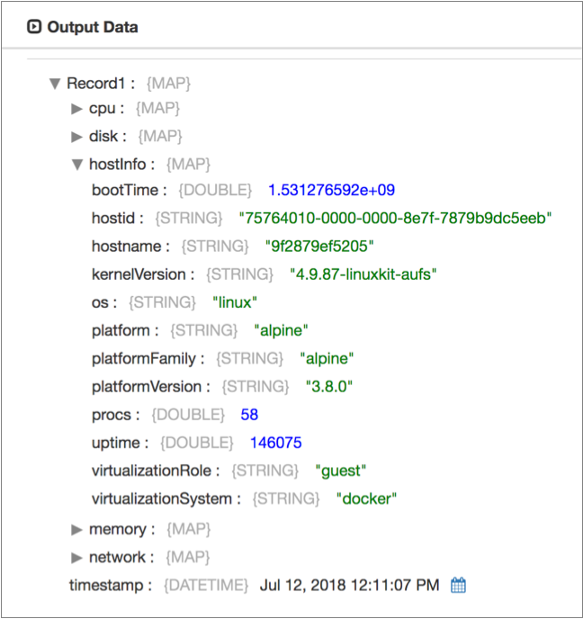
When we expand the hostInfo map field, preview displays the host information collected for a Linux operating system:
Filter Process Metrics
The System Metrics origin can read metrics from processes running on the edge device. When configured to read process metrics, the origin reads statistics for all running processes by default.
On the Process tab, you can filter the processes that the origin reads by the process name or command or by the user that owns the process. To filter by the process name or command, enter the process name or part of the process command in the Processes property. To filter by user, enter the user name for the User property.
.*For example, to read statistics only for processes with names starting with "st", enter the following regular expression for the Processes property:
st.*To read statistics only for processes owned by the root user, enter "root" for the User property.
For more information about using regular expressions with Data Collector, see Regular Expressions Overview.
Configuring a System Metrics Origin
Configure a Systems Metric origin to read system metrics from the edge device where SDC Edge is installed.
-
In the Properties panel, on the General tab, configure the
following properties:
General Property Description Name Stage name. Description Optional description. On Record Error Error record handling for the stage: - Discard - Discards the record.
- Send to Error - Sends the record to the pipeline for error handling.
- Stop Pipeline - Stops the pipeline.
-
On the System Metrics tab, configure the following
properties:
System Metrics Property Description Delay Between Batches Number of milliseconds to wait before creating the next batch of data. Fetch Host Information Includes host information from the edge device, such as the host name, operating system, and platform. Fetch CPU Stats Includes CPU statistics from the edge device, such as the number of available cores and the percentage of CPU being used. Fetch Memory Stats Includes memory statistics from the edge device, such as the amount of available and used memory on the device. Fetch Disk Stats Includes disk statistics from the edge device, such as the serial number and disk partitions of the device. Fetch Network Stats Includes network statistics from the edge device, such as information about the open connections on the device. Fetch Process Stats Includes statistics from processes running on the edge device. By default, the origin reads statistics for all running processes.
-
When reading process metrics, optionally configure the following properties on
the Process tab to filter the processes:
Process Property Description Processes Regular expression to filter the processes by process name or command. User Regular expression to filter the processes by the user that owns the process.