Tutorial: Data Collectors, Pipelines, and Jobs
This tutorial covers the basic tasks required to get up and running with StreamSets Control Hub. In this tutorial, we register a Data Collector with Control Hub, design and publish a pipeline, and create and start a job for the pipeline.
Although our tutorial provides a simple use case, keep in mind that Control Hub is a powerful tool that enables you to orchestrate and monitor large numbers of pipelines running on groups of Data Collectors.
To get started with Control Hub, we'll complete the following tasks:
Before You Begin
This tutorial assumes that you have a running StreamSets Data Collector and a user account to log in to Control Hub.
Data Collectors work directly with Control Hub - they execute standalone and cluster pipelines run from Control Hub jobs.
Before you begin this tutorial, you'll need a few things:
-
A running Data Collector.
If you haven't already, download and install Data Collector. For installation instructions, see Installation in the Data Collector documentation.
-
A user account within a Control Hub organization.
If you already have an organization defined for your enterprise, ask the organization administrator for a user account. If you don’t have access to an organization, contact StreamSets with a request for a new organization.
The initial user account created for your organization has all of the roles required to complete these tutorials.
Register a Data Collector
You register Data Collectors from Control Hub. StreamSets recommends registering the latest version of Data Collector to ensure that you can use the newest features.
For a Data Collector installation with Cloudera Manager, you must use Cloudera Manager to register the Data Collector.
-
Enter the following URL in the address bar of your browser:
https://cloud.streamsets.com -
Enter your Control Hub user ID and click Continue.
User IDs use the following format:
<ID>@<organization ID>. -
Enter your password and click Log In.
The Dashboards view displays, presenting a summary of your organization's activity in Control Hub.
- In the Navigation panel, click .
-
Click the Generate Authentication Tokens icon
 .
.
- Enter 1 for the number of tokens to generate.
-
Click Generate.
The Authentication Tokens window displays the generated token.
-
Record the generated token.
Copy the token from the window. Or, click Download to download the token to a JSON file named
authTokens.json. - Click Close in the Authentication Tokens window.
-
Complete the following steps for Data Collector:
-
In the Navigation Panel, click .
In the Data Collectors view, we can see the Data Collector that we just registered with Control Hub:
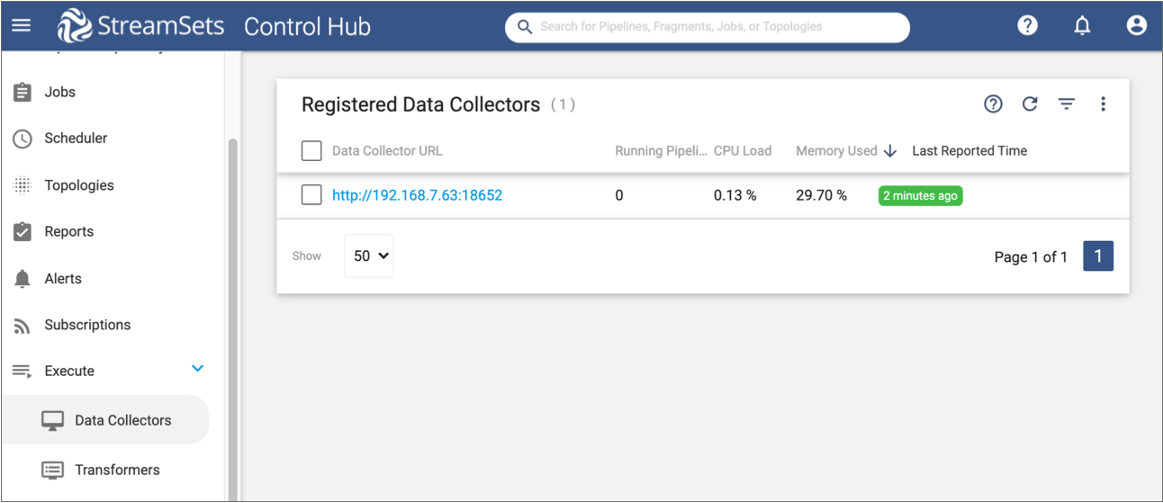
So far, we have only registered one Data Collector, but you will most likely register multiple Data Collectors. All registered Data Collectors are listed in this view.
-
Click the last reported time for our registered Data Collector to expand the details.
The Data Collector details include historical time series charts for the CPU load and memory usage of the Data Collector. The details also include the Data Collector ID, URL, last reported time, version, and labels - which is the next topic in our tutorial.
Assign Labels to the Data Collector
Use labels to group Data Collectors registered with Control Hub. You assign labels to each Data Collector, using the same label for Data Collectors that you want to function as a group.
When you create a job, you assign labels to the job so that Control Hub knows on which group of Data Collectors the job should start.
For example, your organization uses development and test environments to design and test pipelines before replicating the final pipelines in the production environment. You assign a Test label to execution Data Collectors used to run test pipelines and a Production label to execution Data Collectors used to run production pipelines. When you create jobs, you select the appropriate label to ensure that the jobs are started in the correct environment.
You can assign multiple labels to Data Collectors to group Data Collectors by a combination of projects, geographic regions, environments, departments, or any other classification you choose.
- Control Hub configuration file
- Define labels for the
dpm.remote.control.job.labelsproperty in the Control Hub configuration file,$SDC_CONF/dpm.properties, located in the Data Collector installation. - Control Hub UI
- View the details of a registered Data Collector in the Control Hub UI, and then add the label.
Let's assume that our newly registered Data Collector is located on the West Coast and will be used to run pipelines for departments located in the west. So we'll use the Control Hub UI to assign a new label to designate the western region.
- In the Data Collectors view, click the last reported time for our registered Data Collector to expand the details.
- Click Enter New Labels and then type: western region.
-
Hit Enter, and then click
Save.
Our Data Collector is now assigned two labels. Note that the only label we can remove from the Control Hub UI is the label that we just added. We'd have to modify the
$SDC_CONF/dpm.propertiesfile in the Data Collector installation to remove the defaultalllabel: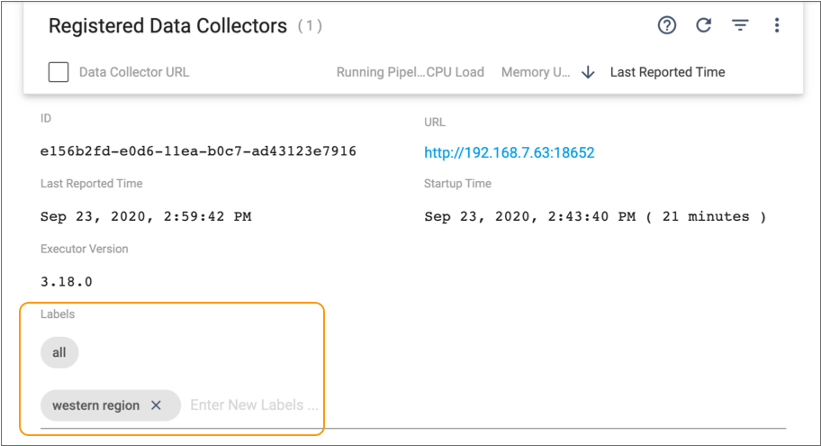
Design a Pipeline
You design pipelines in Control Hub using the Control Hub Pipeline Designer. A pipeline describes the flow of data from an origin system to destination systems and defines how to transform the data along the way.
StreamSets Control Hub provides support for multiple origin and destination systems, such as relational databases, log files, and cloud storage platforms. For a complete list of supported systems, see Origins and Destinations.
For now, we'll design and configure a single test pipeline that uses development stages. If you already have a test pipeline in the Control Hub pipeline repository that you'd like to use, feel free to use it and activate at least one metric rule for it. Otherwise, create a simple pipeline using the development stages and metric rules as described below.
- In the Navigation panel, click .
-
Click the Create New Pipeline icon:
 .
.
- Enter the following name: Tutorial Pipeline.
-
Keep the defaults to create a blank Data Collector pipeline, and then click Next.
Note: You can also use Control Hub to create pipelines for Transformer and to create pipelines from sample pipelines. As you explore the Control Hub Pipeline Designer in more detail, you might want to review the sample pipelines to learn how to develop a similar pipeline.
- Select an authoring Data Collector, and then click Create.
-
From the Pipeline Creation Help bar, click .
-
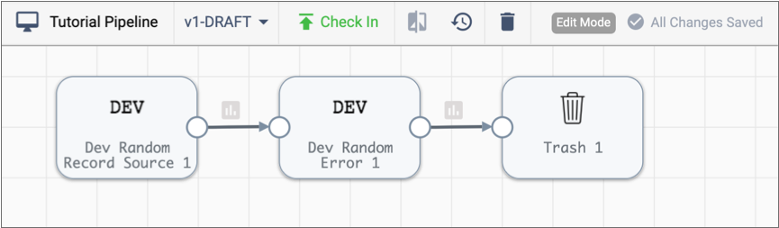
Use the Pipeline Creation Help bar to add the following additional development
stages to the pipeline:
- Dev Random Error processor
- Trash destination
The pipeline canvas should look like this:
Next let's activate a metric rule for the pipeline so that we can see how Control Hub displays alerts. Metric rules and alerts provide notifications about real-time statistics for pipelines.
- Click a blank area in the canvas to display the pipeline properties.
- In the Properties panel, click the Rules tab.
-
Select the High Incidence of Error Records rule and then click
Enable.
This metric rule triggers when the pipeline encounters more than 100 error records. We're sure that this rule will trigger since our tutorial pipeline includes the Dev Random Error processor.
The Metric Rules tab should look like this: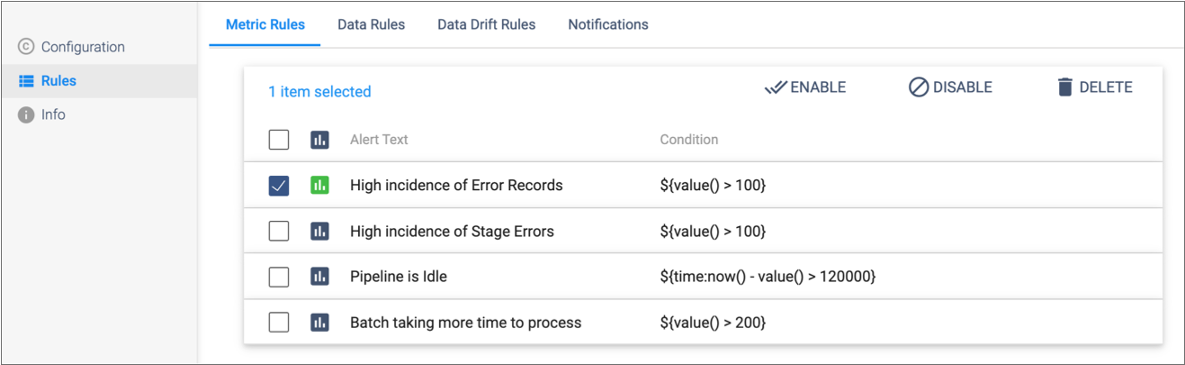
- In the Properties panel, click , and configure the pipeline to discard error records.
Publish the Pipeline
Next, we'll publish the pipeline to indicate that our design is complete and the pipeline is ready to be added to a job and run. When you publish a pipeline, you enter a commit message. Control Hub maintains the commit history of each pipeline.
-
With the tutorial pipeline open in the Pipeline Designer canvas, click the Check In icon:
 .
.
-
Enter a commit message. For now, let's enter: Initial
commit.
As a best practice, state what changed in this pipeline version so that you can track the commit history of the pipeline.
-
Click Publish and Close.
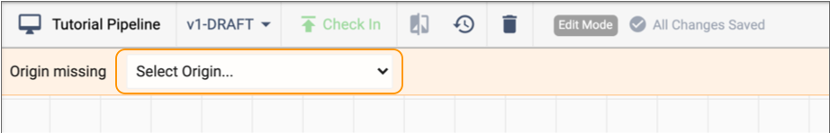
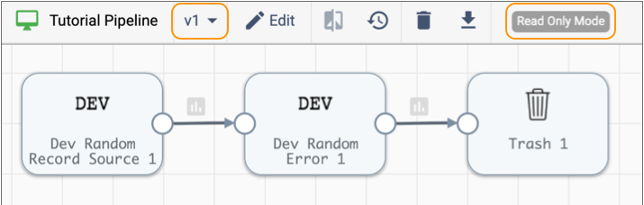
Notice how the top toolbar in the pipeline canvas indicates that this is version v1 of the pipeline and that the pipeline is in read only mode:
 All published pipelines display in read only mode. You must click the Edit icon to create another draft before you can modify the pipeline.Let's modify our published pipeline, and then go ahead and publish the pipeline a second time so that we can view the commit history of the pipeline.
 -
Click the Edit icon:
 .
.
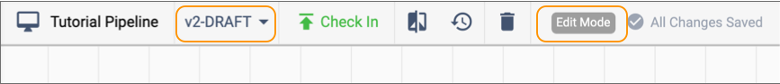
Notice how the top toolbar in the pipeline canvas indicates that this is version v2-DRAFT of the pipeline and that the pipeline is in edit mode:
-
On the General tab for the pipeline, enter the following
text for the Description property: Test
pipeline to try out Control Hub.
Let's go ahead and publish the updated pipeline.
-
Click the Check In icon (), and then enter the following commit message: Another test
commit.
- Click Publish and Close.
-
Click the History icon:
 The Pipeline Commits window displays details about each of our commits:
For now, we haven't changed anything in our two commits. But in a development cycle that involves many pipeline changes, maintaining the commit history helps us understand the changes. We can even get an older version of a pipeline to continue editing the older version. Let's try that now.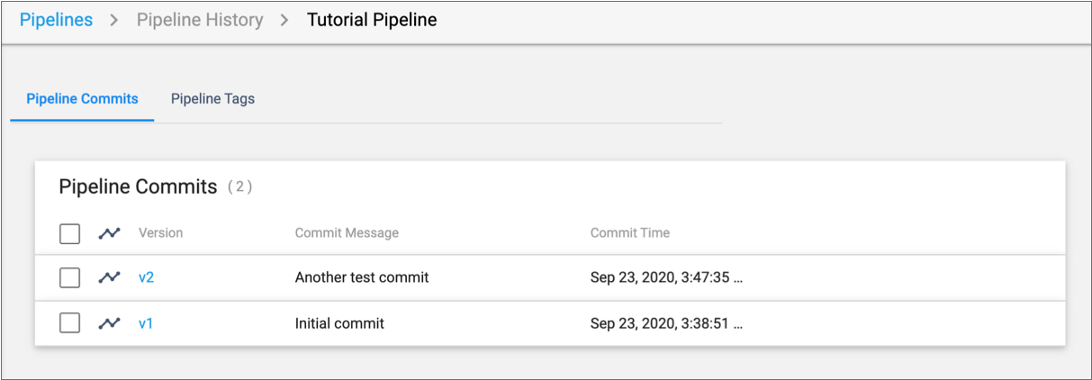
-
In the Pipeline Commits window, simply click the link for
version 1.
Control Hub displays version 1 of our pipeline in the pipeline canvas. We can make edits to version 1 of the pipeline, and then publish a third version of the pipeline.
Now that we've registered Data Collector, designed a pipeline, and published two versions of the test pipeline to Control Hub, let's add the pipeline to a job so that we can run it.
Add a Job for the Pipeline
A job defines the pipeline to run and the Data Collectors that run the pipeline.
When you add a job, you specify the published pipeline to run and you select Data Collector labels for the job. The labels indicate which group of Data Collectors should run the pipeline.
-
With the tutorial pipeline open in the Pipeline Designer canvas, select the
arrow next to the v1 label and then select v2 - our latest version of this
pipeline.
You can create a job for any published pipeline version. But we'll go ahead and create a job for version 2.
-
Click the Create Job icon:
 .
.
- Let's use the default name: Job for Tutorial Pipeline.
-
Click under Data Collector Labels, and then select the
western regionlabel that we assigned to our Data Collector. - Keep the default values for the remaining properties.
-
Click Create.
Control Hub displays our newly created job.
Start and Monitor the Job
Let's start our job and monitor its progress in Control Hub.
-
Click the icon (
 ) for our tutorial job.
Control Hub indicates that the job is active and displays real-time statistics for the job in the Monitor panel.After a bit of time, our High Incidence of Error Records pipeline alert triggers. The alert displays in the monitoring view for the job as follows:
) for our tutorial job.
Control Hub indicates that the job is active and displays real-time statistics for the job in the Monitor panel.After a bit of time, our High Incidence of Error Records pipeline alert triggers. The alert displays in the monitoring view for the job as follows: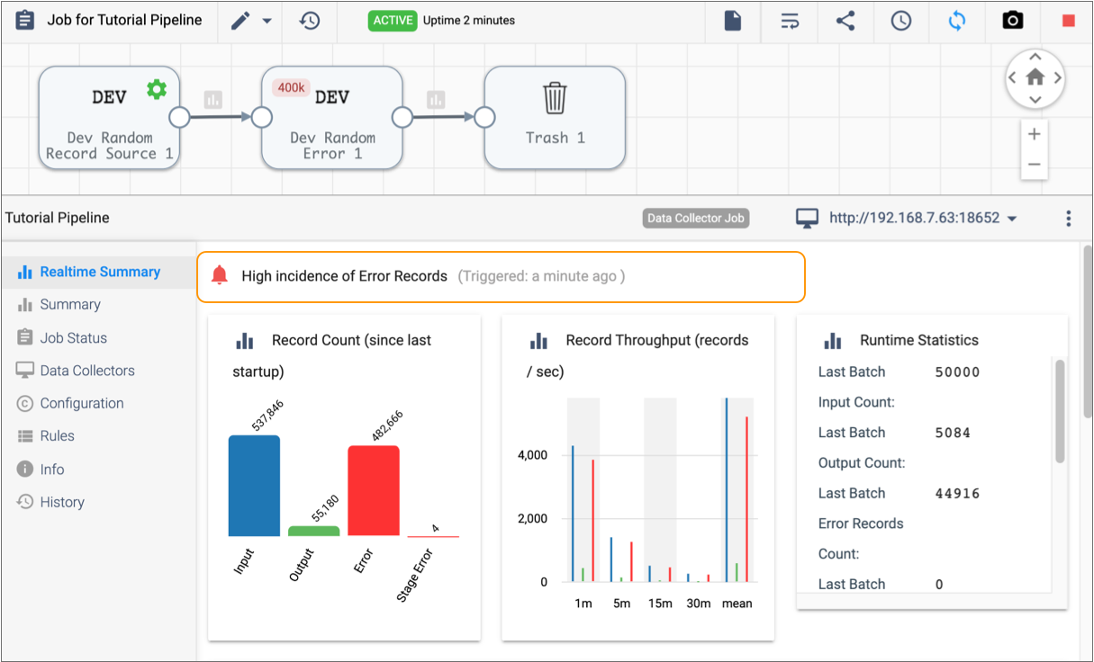 Note: In addition, the Alerts icon (
 ) in the top toolbar indicates that the alert has
triggered. You can click the icon and then click View
All to view the alert in the Alerts view.
) in the top toolbar indicates that the alert has
triggered. You can click the icon and then click View
All to view the alert in the Alerts view.We can view statistics, configuration, and rules details for the entire pipeline using the tabs in the Monitor panel. Or, we can select a stage in the canvas to view statistics and configuration details for that stage.
Let's stop our job so that the pipeline doesn't run indefinitely.
-
Click the Stop Job icon (
 ) for
our active job.
The Confirmation dialog box appears.
) for
our active job.
The Confirmation dialog box appears. -
To stop the job, click Yes.
The job transitions from a deactivating to an inactive state.
That's the end of our Control Hub tutorial on Data Collectors, pipelines, and jobs. Remember that our tutorial was simple by design to introduce the concepts of Control Hub. However, the true power of Control Hub is its ability to orchestrate and monitor many pipelines running across groups of Data Collectors.