Tutorial: Topologies
This tutorial covers working with topologies in StreamSets Control Hub. A topology provides an interactive end-to-end view of data as it traverses multiple pipelines. In this tutorial, we create and publish an SDC RPC origin pipeline and an SDC RPC destination pipeline, create jobs for the pipelines, map the related jobs in a topology, and then measure the progress of the topology.
Although our topology tutorial provides a simple use case, keep in mind that Control Hub enables you to manage topologies for multiple complex pipelines. For example, you can group all data flow activities that serve the needs of one business function under a single topology.
To get started with Control Hub topologies, we'll complete the following tasks:
Design and Publish Related Pipelines
A topology provides a view into multiple related pipelines. To create our related pipelines, we'll configure an SDC RPC origin pipeline that passes data to an SDC RPC destination pipeline.
Then, we'll publish both pipelines to indicate that our design is complete and the pipelines are ready to be added to jobs and run.
- In the Navigation panel, click .
-
Click the Create New Pipeline icon:
 .
.
- Enter the following name: Origin Pipeline.
- Keep the defaults to create a blank Data Collector pipeline, and then click Next.
- Select an authoring Data Collector, and then click Create.
-
Use the Pipeline Creation Help bar to add the following stages to the
pipeline:
- Dev Random Record Source origin
- Dev Random Error processor
- SDC RPC destination
-
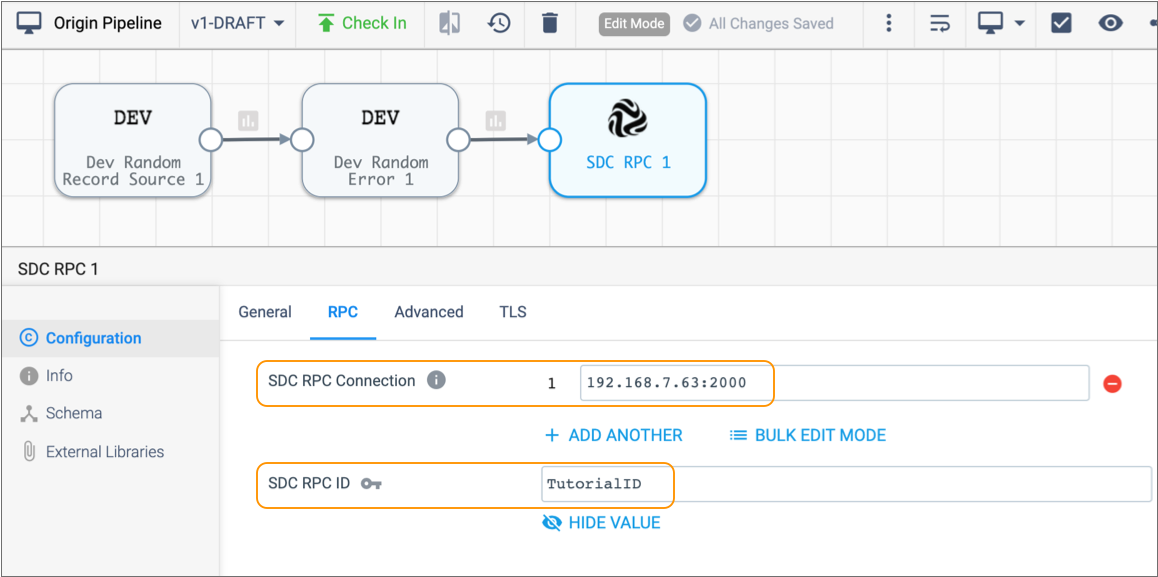
In the SDC RPC destination, configure the following properties on the
RPC tab.
Use the defaults for properties that aren't listed:
RPC Property Description SDC RPC Connection Enter the host name of the machine running Data Collector and an available port number on the machine, using the following format: <host name>:<port number>SDC RPC ID Enter: TutorialID At this point, the origin pipeline should look like this:
-
Click the Check In icon:
 .
.
-
Enter a commit message, and then click Publish and
Close.
Now let's use similar steps to create our SDC RPC destination pipeline.
-
Click the Navigation Panel icon (
 ), and then click .
-
Create another pipeline titled Destination Pipeline and
add the following stages to the pipeline:
- SDC RPC origin
- Dev Random Error processor
- Trash destination
-
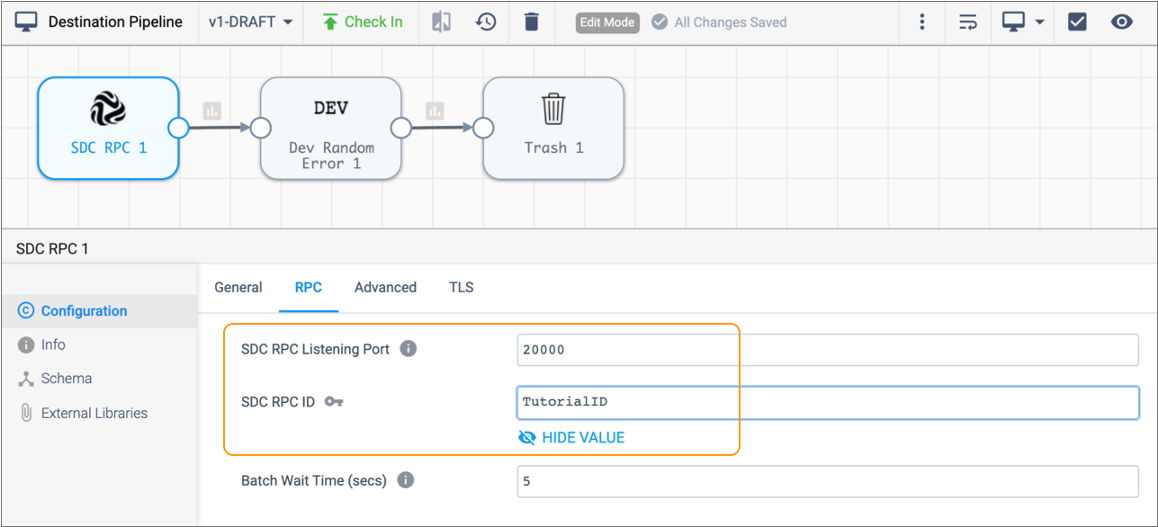
In the SDC RPC origin, configure the following properties on the
RPC tab.
Use the defaults for properties that aren't listed:
RPC Property Description SDC RPC Listening Port Enter the same port number that you entered for the SDC RPC destination in step 7. SDC RPC ID Enter: TutorialID At this point, the destination pipeline should look like this:
-
Click the Check In icon: .
- Enter a commit message, and then click Publish and Close.
Now that we've designed and published related pipelines, let's add jobs for the related pipelines.
Add Jobs for the Related Pipelines
You map jobs that contain related pipelines in a topology. Let's create jobs for the related pipelines that we just published.
- In the Navigation panel, click .
-
Select both the destination and origin pipelines in the job list, and then
click the Create Job icon:
 .
The Add Jobs window displays two pages - one for each pipeline that we selected.
.
The Add Jobs window displays two pages - one for each pipeline that we selected. - For the name of the destination job, enter: Tutorial Destination Job.
- Click under Data Collector Labels, and then select the western region label.
- Keep the default values for the remaining properties.
-
Click Next.
Now let's complete the same steps for our SDC RPC origin pipeline.
- For the name of the job, enter: Tutorial Origin Job.
-
Select western region for the label, and then click
Create.
The Jobs view lists our two newly created jobs.
Map Jobs in a Topology
We'll add a topology and then map the jobs that work together to create a complete data flow.
- In the Navigation panel, click Topologies.
-
Click the Add Topology icon:
 .
.
-
Let's enter the name Tutorial Topology and then click
Save.
Control Hub displays an empty topology in the canvas. Next, we'll add our related jobs.
-
Click the Add Job icon, and select Tutorial
Origin Job.
Control Hub adds our origin job to the topology canvas, using circular icons for the connecting systems:
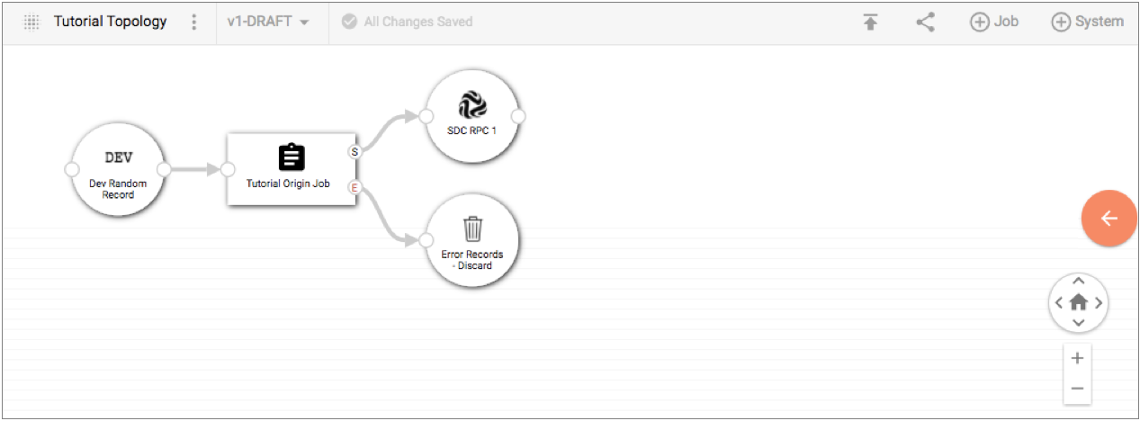
Our tutorial origin job connects to the following systems:
- Dev Random Record - The origin of our pipeline. Since we are using one of the development stages, we don't have another related job that sends data into this origin.
- SDC RPC 1 - The destination of our pipeline. We'll connect our related tutorial destination job to this system.
- Error Records Discard - A visualization of the error record handling
configured for the pipeline. Since we are discarding our error records,
we don't have another related job that processes those records. However,
if we had written the error records to another system - for example,
Kafka or Elasticsearch - we could connect a job that reads the records
from that system.
You can delete a connecting system in a topology if you do not want to measure the flow of data through the system. For example, in a complex topology, you might want to delete the Error Records Discard system in the canvas. However, we'll leave it in our example since we're designing a simple topology.
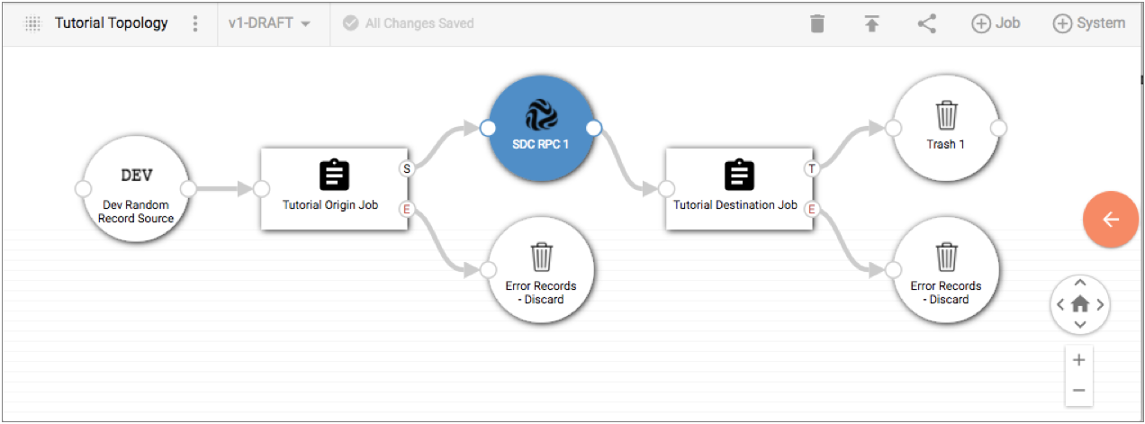
- Select the SDC RPC 1 system displayed in the canvas.
-
Click the Add Job icon again, and select
Tutorial Destination Job.
Control Hub adds our destination job to the topology canvas, connecting it to the SDC RPC 1 system. The canvas displays each job and connecting system as follows:
-
Let's double-click our Tutorial Origin Job in the canvas.
Control Hub displays details about the selected job in the detail pane.
-
Expand the Origin Pipeline section in the detail pane to see how we can view
the design of a pipeline from a topology.
Control Hub displays the complete pipeline included in our tutorial origin job:
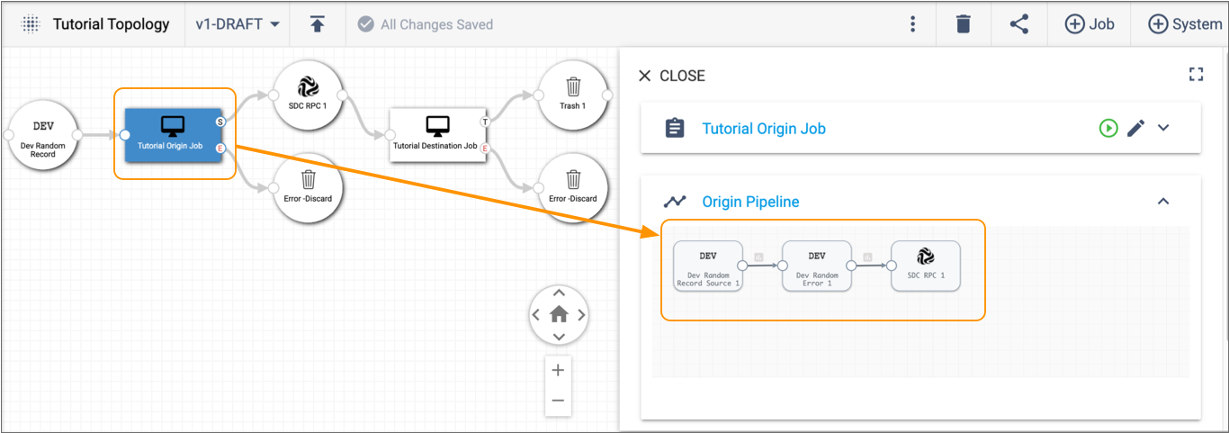
You can view the design of each pipeline included in a topology, providing you with a central view into the complete data flow.
Measure and Monitor the Topology
You can measure and monitor the progress of all running pipelines included in a topology. Let's start the jobs and then measure the progress of the running pipelines from our topology view.
-
Select the Tutorial Destination Job in the topology canvas, and then click the
Start Job icon:
 .
Control Hub notifies you that the job is active.
.
Control Hub notifies you that the job is active. - Select the Tutorial Origin Job in the canvas, and click the Start Job icon.
-
Click the topology canvas to return focus to the topology instead of the origin
job.
The detail pane provides a single view into the record count and throughput for all jobs in the topology:
You can select any job or system in the topology canvas to monitor the progress of that job or system. For example, if we select our tutorial origin job, the detail pane displays the statistics and metrics for that job.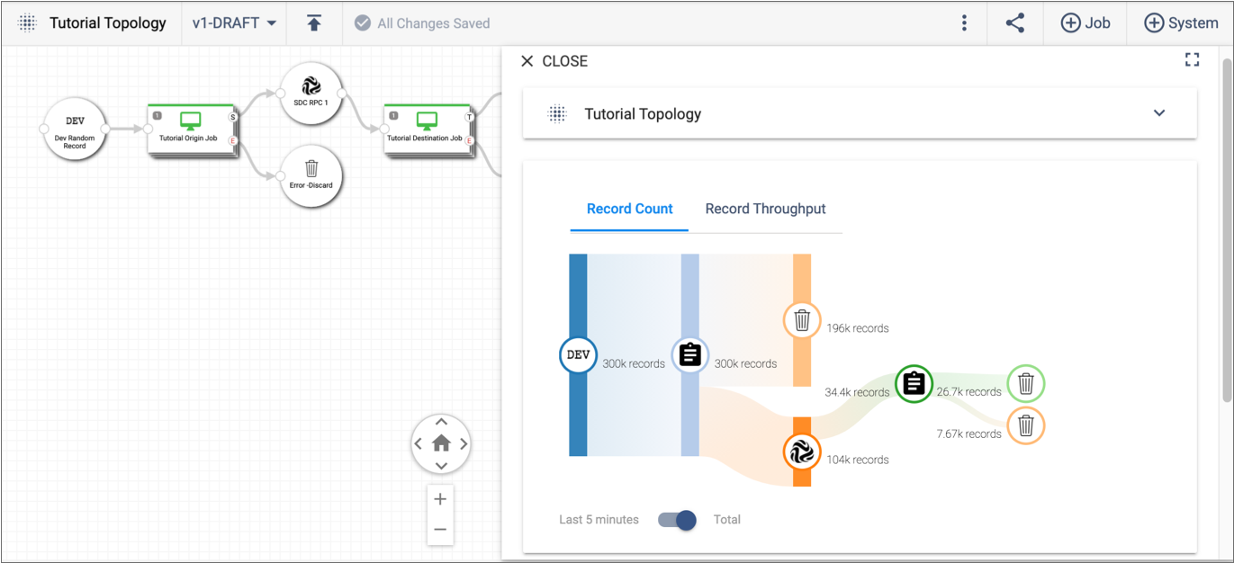
That's the end of our Control Hub tutorial on topologies. Remember that our tutorial included only two simple jobs to introduce the concept of topologies. However, you can use Control Hub to manage and monitor topologies for multiple complex jobs.