Design in Control Hub
You can design pipelines and pipeline fragments in Control Hub using the Control Hub Pipeline Designer. You can use Pipeline Designer to develop pipelines and fragments for Data Collector or Transformer.
Pipeline Designer enables you to configure pipelines, preview data, and publish pipelines. You can also design and publish pipeline fragments.
You can create new pipelines or edit previously published pipelines. When you create a pipeline in Pipeline Designer, you can start with a blank canvas or with a sample pipeline. Pipeline Designer provides several system sample pipelines. You can also create user-defined sample pipelines. Use the Pipelines view to create a new pipeline or to access existing pipelines in the pipeline repository.
You can also create or edit previous published fragments. When you create a fragment in Pipeline Designer, you start with a blank canvas. Use the Pipeline Fragments view to create a new fragment or access existing fragments.
When you configure a pipeline or pipeline fragment in Pipeline Designer, you specify the authoring engine to use - Data Collector or Transformer. Pipeline Designer displays stages, stage libraries, and functionality based on the selected authoring engine.
For more information about using Pipeline Designer, see Pipeline Designer UI and Pipeline Designer Tips.
Authoring Engine
When you create or edit a pipeline or pipeline fragment, you select the authoring engine to use - Data Collector or Transformer. You can select an accessible authoring engine that is registered with your Control Hub organization and that meets all of the requirements.
Choose an authoring engine that is the same version as the engines that you intend to use to run the pipeline. Using a different version can result in pipelines that are invalid when they are run.
For example, if the authoring Data Collector is a more recent version than the execution Data Collector, pipelines might include a stage, stage library, or stage functionality that does not exist in the execution Data Collector.
- As a best practice, use the latest version of Data Collector or Transformer.
The minimum supported Data Collector version is 3.0.0.0. To design pipeline fragments, the minimum supported Data Collector version is 3.2.0.0. To create and use connections, the minimum supported Data Collector version is 3.19.0.
- The Data Collector or Transformer uses the HTTPS protocol because Control Hub also uses the HTTPS protocol. Note: Use a certificate signed by a certifying authority for a Data Collector or Transformer that uses the HTTPS protocol. If you use a self-signed certificate, you must first use a browser to access the Data Collector or Transformer URL and accept the web browser warning message about the self-signed certificate before users can select the component as the authoring engine.
- The Data Collector or Transformer URL is reachable from the Control Hub web browser.
For more information about how a registered Data Collector works as an authoring Data Collector, see Registered Data Collector.
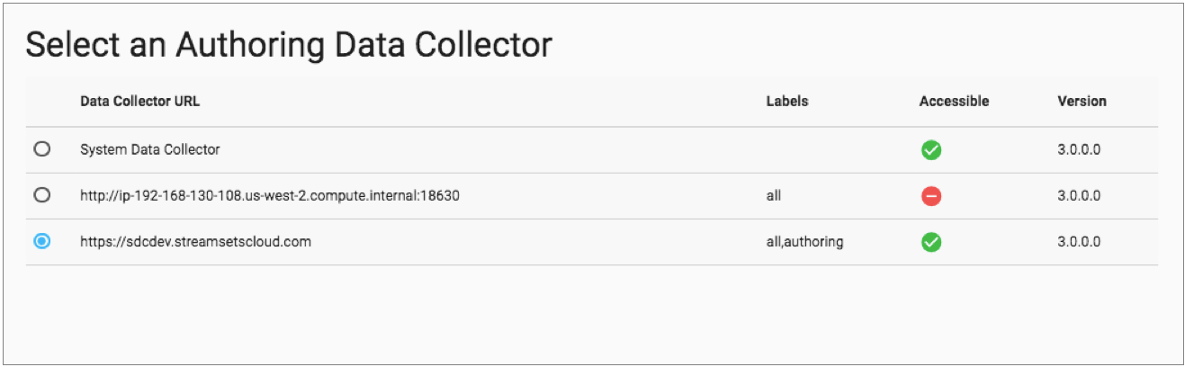
For example, the following Select an Authoring Data Collector window displays the system Data Collector and two registered Data Collectors as choices for the authoring Data Collector. Notice how the second registered Data Collector listed in this image is not accessible and thus cannot be selected because it uses the HTTP protocol:
When you edit a pipeline or fragment in the pipeline canvas, you can change the authoring engine as long as you select the same engine type. For example, when editing a Data Collector pipeline, you can select another authoring Data Collector. You can cannot select an authoring Transformer.
Click the Authoring icon (![]() )
in the top right corner of the canvas to view which authoring engine is being used and
to optionally change the selection.
)
in the top right corner of the canvas to view which authoring engine is being used and
to optionally change the selection.
For example, the following image shows the currently selected authoring Data Collector:

Data Collector Stage Libraries
The selected authoring Data Collector determines the stage libraries that are installed and available for use as you design those pipelines and pipeline fragments.
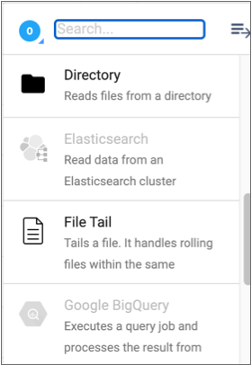
The stage library panel in the pipeline canvas displays all stages. Stages that are not installed on the selected authoring engine appear disabled, or greyed out. For example, the following stage library panel indicates that the Elasticsearch and Google BigQuery origins are not installed:
When the selected authoring Data Collector is a tarball installation, you can install additional stage libraries, including enterprise stage libraries, from the pipeline canvas. To install an additional stage library, click on a disabled stage. Confirm that you want to install the library, and then restart the engine for the changes to take effect.
When the selected authoring Data Collector is a core RPM installation, you must install additional RPM stage libraries using the Data Collector command line program, as described in Install Additional Stage Libraries in the Data Collector documentation.
When the selected authoring Data Collector is an RPM or Cloudera Manager installation, you must install enterprise stage libraries as custom stage libraries as described in Enterprise Stage Libraries in the Data Collector documentation.
External Libraries
The selected authoring Data Collector or Transformer determines the external libraries available to stages as you design pipelines and pipeline fragments. For example, some stages, such as most JDBC stages, require installing a JDBC driver as an external library on Data Collector or Transformer.
As you design Data Collector or Transformer pipelines, each stage requiring an external library displays the currently installed libraries in the External Libraries tab in the stage properties panel.
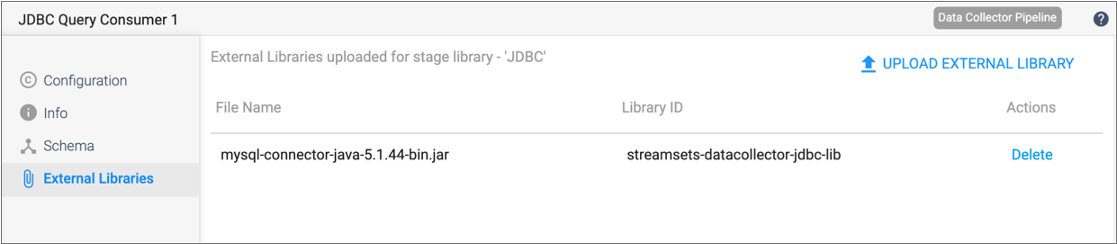
For example, the following image shows that a MySQL JDBC driver is installed for the JDBC stage library on the selected authoring Data Collector. As a result, this external library is available to the JDBC Query Consumer origin during pipeline design:
$SDC_DIST/streamsets-libs-extrasdirectory on the selected authoring Data Collector$TRANSFORMER_DIST/streamsets-libs-extrasdirectory on the selected authoring Transformer
For more information about installing external libraries on Data Collector, see Install External Libraries in the Data Collector documentation.
For more information about installing external libraries on Transformer, see External Libraries in the Transformer documentation.
Pipeline Designer UI
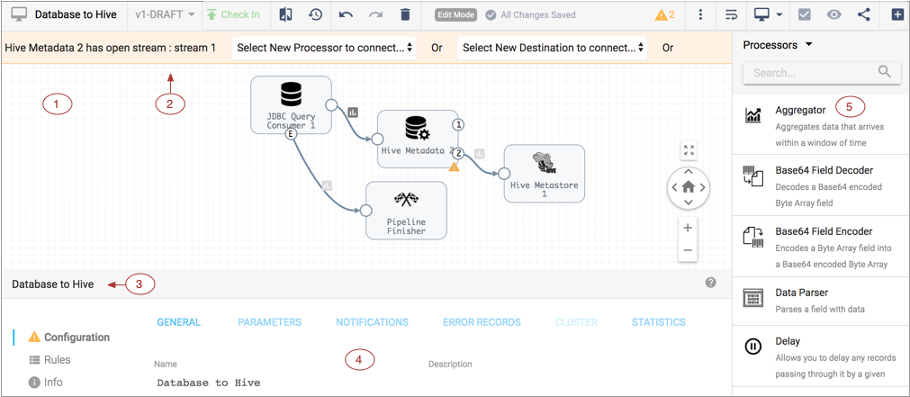
The following image shows the Pipeline Designer UI when you configure a pipeline:
| Area/Icon | Name | Description |
|---|---|---|
| 1 | Pipeline Canvas | Displays the pipeline. Use to configure the pipeline data flow. |
| 2 | Pipeline Creation Help Bar | Offers lists of stages to help complete the pipeline. You can use the help bar to connect a stage to an open node. You can also add a stage between linked stages by clicking the link. |
| 3 | Properties panel | Displays the properties of the pipeline or selected stage when you configure a pipeline. |
| 4 | Selected stage pop-up menu | Displays the icons for commands that you can apply to the selected stages. |
| 5 | Stage library panel | List of available stages. Use to add stages to the pipeline. You can drag a
stage to a location on the canvas or click a stage to add it to the end of the
pipeline. You can view all stages, stages by type, or stages by library. You can also search for a stage by name. Stages that are not installed appear disabled, or greyed out. Click on a disabled stage to install the stage library that includes the stage. |
| Pipeline name display | Displays the name of the pipeline in the canvas. | |
| Pipeline version display and selection | The version of the pipeline in the canvas. To select a different version, click the icon and select the version to view. | |
| Check In icon | Publishes the pipeline or fragment in the canvas. Displays for pipelines
only when the pipeline passes implicit validation. When the pipeline has already been published, the Edit icon displays in the same location. Publish a pipeline to enable creating a job for the pipeline. Publish a fragment to enable using the fragment in a pipeline. |
|
| Edit icon | Enables editing the pipeline or fragment. Displays when the pipeline or
fragment has already been published and is being viewed in read only
mode. When the pipeline or fragment is already in edit mode, the Check In icon displays in the same location. |
|
| Compare with Previous Version icon | Compares the pipeline or fragment in the canvas with a previous version. | |
| History icon | Displays the history of the pipeline or fragment in the canvas. | |
| Undo icon |
Reverts recent changes. On Mac, you can also use Command+Z. On Windows, you can use Ctrl+Z. |
|
| Redo icon |
Restores changes that were reverted. On Mac, you can also use Command+Shift+Z. On Windows, you can use Ctrl+Y. |
|
| Delete Draft or Delete Pipeline icon | Deletes the draft version or published version of a pipeline. | |
| Validation Errors icon | Lists the number of validation errors for implicit validation. Click to view the error messages. | |
| More icon | Provides additional pipeline actions to take. | |
| Auto Arrange icon | Automatically arranges the stages on the canvas. | |
| Authoring icon | Authoring engine associated with the pipeline. You can click the icon and select a different engine to use. | |
| Validate icon | Validates the pipeline. Performs explicit validation. Displays when the pipeline is in edit mode and passes implicit validation. |
|
| Preview icon | Starts data preview. Available for valid pipelines and fragments. Not available when using the system Data Collector for authoring. |
|
| Share icon | Shares the pipeline or fragment with users and groups. Use to configure permissions for the pipeline or fragment. | |
| Create Job icon | Creates a job based on the pipeline. Creates a job for a published pipeline. | |
| Stage Library icon | Toggles the display of the Stage Library panel. | |
| Duplicate Stage icon | Duplicates the selected stage. | |
| Create Pipeline Fragment icon | Creates a pipeline fragment from the selected stages. | |
| Delete icon | Deletes the selected item in the canvas. | |
| Expand Fragments icon | Expands either all or the selected fragment stages in the pipeline, displaying all the stages in the fragments. | |
| Collapse Fragments icon | Collapses expanded pipeline fragments, displaying a single fragment stage for each fragment. | |
| Stream link icon | Indicates the flow of data through the pipeline or fragment. Select to
configure data rules and alerts. Darker icons indicate that a data rule is configured for the link. |
|
| Error icon | Indicates that one or more required properties are not defined. Can display
on a stage for stage properties or in the canvas for pipeline properties.
Related error messages display when you hover over the icon. You can also view the messages in the Validation Errors list. The icon can also display on tabs in the properties panel to indicate the location of missing properties. |
Pipeline Designer Tips
- Authoring engine
- When configuring a Data Collector or Transformer pipeline or pipeline fragment, you must select the authoring engine to use. You can select any accessible Data Collector, either the system Data Collector if available or a registered Data Collector. However, to perform explicit validation or data preview, you must select a registered Data Collector as the authoring Data Collector.
- Create a pipeline or fragment
- When you create a pipeline or pipeline fragment, you specify whether the pipeline will run on Data Collector or Transformer. For pipelines, you can start with a blank canvas or an existing template.
- Edit a published pipeline or fragment
- When viewing a published pipeline or pipeline fragment, Control Hub displays the pipeline or fragment in read-only mode.
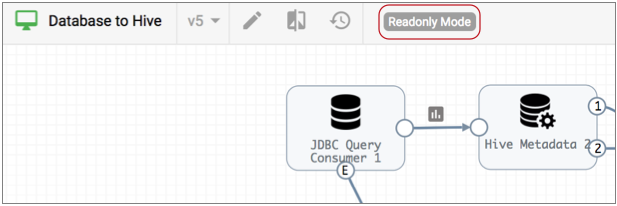
- To edit a published pipeline or fragment, click the Edit icon:
 . The pipeline or fragment then enters edit
mode.
. The pipeline or fragment then enters edit
mode. - Select multiple stages
- When editing a pipeline or pipeline fragment, you can select multiple stages in the pipeline canvas and then move, delete, or copy the selected stages. To select multiple stages in the canvas, press the Shift key and then click each stage.
- Copy and paste multiple stages and fragments
- After selecting multiple stages or fragments in the pipeline canvas, you can
copy them to the clipboard by clicking Copy to Clipboard in the properties
panel below the canvas. Or, to copy the selected stages and fragments to the
clipboard on Mac, you can also use
Command+C. On Windows, you can useCtrl+C. - Update stage libraries for the pipeline
- When editing a pipeline or pipeline fragment, you can use the Update Stage Libraries dialog box to update the stage libraries for multiple stages in the pipeline or fragment.
- To update multiple stage libraries at one time, click the
More icon (
 ),
then select Update Stage
Libraries.
),
then select Update Stage
Libraries. 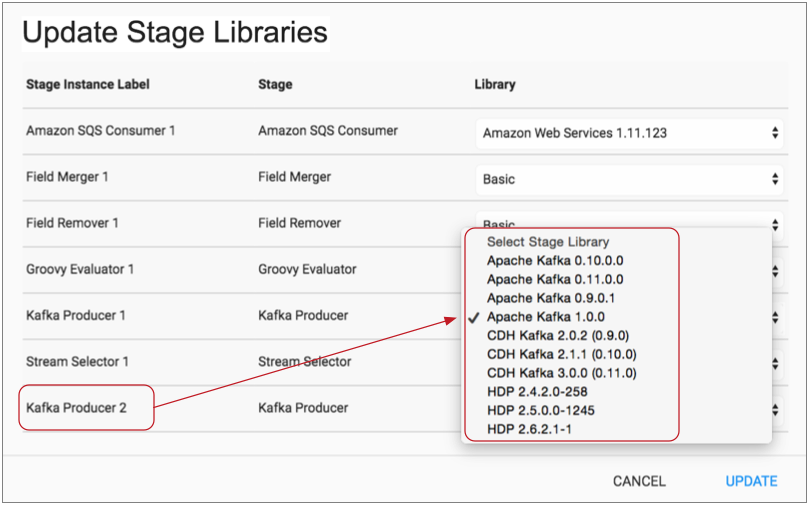
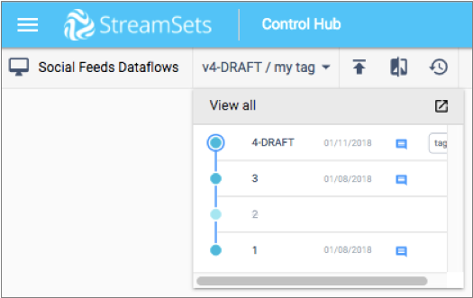
- Work with versions
- When you have multiple versions of a pipeline or pipeline fragment, Control Hub indicates the version of the pipeline or fragment that you are viewing. You can click the pipeline or fragment version to select a different version to view, as follows:
- Run a test of a draft pipeline
- When editing a pipeline, you can perform a test run of the draft pipeline to quickly test the pipeline logic. You can perform a test run of a draft version of a fully configured pipeline
- Publish a pipeline or fragment
- When you have completed work on a pipeline or fragment, you publish or check in the pipeline or fragment. Publish a pipeline to create and run jobs based on the pipeline. Publish a fragment to make it available for testing or use in pipelines.
- Use the Check In icon to publish a valid pipeline or fragment:
 . Enter a commit message stating what changed
in this version so that you can track the commit history of the pipeline or
fragment.
. Enter a commit message stating what changed
in this version so that you can track the commit history of the pipeline or
fragment. - Create a job
- After you publish a pipeline, you can create a job.
- You can create a job using the Create Job icon (
 ) in the toolbar above
the pipeline canvas. Or, you can create a job from the Jobs view.
) in the toolbar above
the pipeline canvas. Or, you can create a job from the Jobs view. - Data preview requirement
- You can preview data when the pipeline uses a registered Data Collector or Transformer as the authoring engine.
- If the pipeline uses the system Data Collector or a selected registered engine that is not accessible, the Preview
Pipeline icon (
 ) is disabled.
 - Validation requirement
- You can perform explicit validation when the pipeline uses a registered Data Collector or Transformer as the authoring engine.
- Use the Validate icon to perform explicit validation:
 .
.
Creating a Pipeline
Create a pipeline to define how data flows from origin to destination systems and how the data is processed along the way.
You can create pipelines using a blank canvas or using a sample pipeline. Control Hub provides system sample pipelines. You can also create user-defined sample pipelines. You can review sample pipelines to learn how you might develop a similar pipeline, or you might use the samples as a starting point for pipeline development.
When you create a pipeline, you specify the type to create - Data Collector, or Transformer, whether to start from a blank canvas or from a sample pipeline, and the authoring engine to use. You can change the authoring engine used during development.
- In the Navigation panel, click .
- Click the Add icon.
- Enter the name and optional description.
- Select the type of pipeline to create: Data Collector or Transformer.
-
Select how you want to create the pipeline, and then click
Next.
- Blank Pipeline - Use a blank canvas for pipeline development.
- Sample Pipeline - Use an existing sample pipeline as the basis for pipeline development.
- If you selected Sample Pipeline, in the Select a Sample Pipeline dialog box, filter by the sample type, select the sample to use, then click Next.
-
Select the authoring Data Collector or Transformer to use, then click Create.
Control Hub opens a blank canvas or the selected sample pipeline.
Creating a Fragment
- In the Navigation panel, click .
-
Click the Create New Pipeline Fragment icon:
 .
.
- In the New Pipeline Fragment dialog box, specify a name, optional description, and the execution engine to use.
- Click Next
-
Select an available authoring Data Collector or Transformer, and then click Create.
If you use the system Data Collector, you cannot use data preview to help develop the fragment.
A blank canvas displays.
Running a Test of a Draft Pipeline
As you design a pipeline, you can perform a test run of the draft pipeline in the pipeline canvas. Perform a test run of a draft pipeline to quickly test the pipeline logic.
You can perform a test run of a draft version of a fully configured pipeline. The Test Run menu becomes active when a draft pipeline is complete.
You cannot perform a test run of a published pipeline version. To run a published pipeline version, you must first create a job for the published pipeline version and then start the job.
-
While viewing a draft version of a completed pipeline in the pipeline canvas,
click Test Run in the top right corner of the toolbar,
and then select one of the following options:
- Start Pipeline - Start a test run of the pipeline.
- Reset Origin and Start - Reset the origin and then start a test run of the pipeline.
- Start with Parameters - Specify the parameter values to use and then start a test run of the pipeline.
When the test run starts, statistics for the test run display in the Monitor panel.
-
Monitor the test run of the pipeline, including viewing real-time statistics
and error information.
To access the history of previous test runs for the pipeline, click the Test Run History tab. The test run history includes the start and end time of previous test runs and also the input, output, and error record count for each test run.
Click View Summary for a specific run to view a summary of the metrics for that test run.
-
When you've finished monitoring the test run, click the Stop Test
Run icon:
 .
You can continue designing the pipeline and performing additional test runs until you decide that the pipeline is complete, and then publish the pipeline.
.
You can continue designing the pipeline and performing additional test runs until you decide that the pipeline is complete, and then publish the pipeline.
Publishing a Fragment or Pipeline
You can publish fragments and pipelines that are designed in the pipeline canvas.
Publish a fragment to use the fragment in a pipeline. Pipelines can only use published fragments.
Publish a pipeline to create a job that runs the pipeline, to use the pipeline as a sample pipeline, or to retain the published pipeline version for historical reference. You can only use published pipelines in jobs or as sample pipelines.
You can only publish valid pipelines. Control Hub performs explicit validation before publishing a pipeline.
- While viewing a fragment or pipeline in edit mode, click the Check
In icon: .
The Check In window appears.
- Enter a commit message.
As a best practice, state what changed in this version so that you can track the commit history of the fragment or pipeline.
- Click one of the following buttons:
- Cancel - Cancels publishing the fragment or pipeline.
- Publish and Update - Publishes the fragment
or pipeline, and then displays the pipelines or jobs that currently
use the published fragment or pipeline.
Select the pipelines or jobs that you want to update to use the latest published version and click Update. Review the pipelines or jobs to be updated, and then click Close. When publishing a pipeline, you can also choose to create a new job for this pipeline version.
Or, choose to skip the update and close the window. When publishing a pipeline, you can also choose to skip the update and create a new job for this pipeline version. - Publish and Close - Publishes the fragment or pipeline.