Data Preview
Data Preview Overview
You can preview data to help build or fine-tune a pipeline. When using Control Hub, you can also use data preview when developing pipeline fragments.
You can use data preview with complete or incomplete pipelines and fragments. And you can choose from several options to provide source data for the preview.
When you preview data, source data passes through the pipeline or fragment, allowing you to review how the data passes and changes through each stage. You can edit stage properties and run the preview again to see how your changes affect the data. You can also edit preview data to test and tune the pipeline logic.
You can preview data for one stage at a time or for a group of stages. You can also view the data in list or table view, and refresh the preview data.
After running preview, you can view the input and output schema for each stage on the Schema tab in the pipeline properties panel.
Data Preview Availability
You can preview complete and incomplete pipelines and Control Hub pipeline fragments. The Data Preview icon becomes active when data preview is available.
- The authoring Data Collector is an available registered Data Collector.
- All stages in the pipeline are connected
- All required properties are defined
Source Data for Data Preview
- Data from the origin - Use available data from the origin.
- Data from the test origin - Use data from the test origin configured in the pipeline or fragment properties.
- Data from a snapshot - Use snapshot data from the same pipeline, another pipeline, or from an active job. Available for pipelines only.
Writing to Destinations and Executors
Since data preview is a tool for development, by default, it does not write data to destination systems or pass data to executors in the pipeline.
Data preview also does not display the data that is written by destinations in the pipeline. You can, however, view the data that is passed to a destination stage, which is typically similar to what is written to destination systems.
If you like, you can configure the preview to write data to destination systems and to pass data to executors in the pipeline, which triggers their actions. For example, you might enable writing to an executor to verify that it performs the configured task as expected.
To write to destination systems and pass data to executors, in the Preview Configuration dialog box, select Write to Destinations and Executors.
Notes
- Date, datetime, and time data - Data preview displays date,
datetime, and time data using the default format of the browser locale. For
example, if the browser uses the en_US locale, preview displays dates using
the following format: MMM d, y h:mm:ss a.
Data preview displays date, datetime, and time data using the time zone that you select in the preview configuration. By default, data preview displays data using the browser time zone.
- Oracle CDC pipelines - When previewing a pipeline with
the Oracle CDC origin, preview generates a
maximum of 10 records, ignoring the Preview Batch Size property when set to
a higher value.
Also, preview allows up to 5 seconds for the origin to receive records, which starts after connecting to Oracle. As a result, when previewing a pipeline with an Oracle CDC origin, preview ignores the configured Preview Timeout property when set to a higher value.
- Oracle CDC Client pipelines - Due to the complex nature of the Oracle
CDC Client origin, initiating preview can take longer than expected. If
preview times out, try increasing the Preview Timeout property incrementally
to allow the origin time to connect.
Also, to generate more than one preview record, set the Max Batch Wait Time property for the origin to a value greater than 0.
- Whole file data format - When previewing a pipeline that processes whole file data, data preview displays only one record.
Preview Codes
Data preview displays different colors for different types of data. Preview also uses other codes and formatting to highlight changed fields.
| Preview Code | Description |
|---|---|
| Black values | Date data |
| Blue values | Numeric data |
| Green values | String data |
| Red values | Boolean data |
| Asterisk | Records that include edited field values |
| Red italic field labels | Fields that contain edited data |
| Light red background | Fields removed by a stage |
| Italic values | Edited data |
| Green stage | First stage in a multiple-stage preview |
| Red stage | Last stage in a multiple-stage preview |
Input and Output Schema for Stages
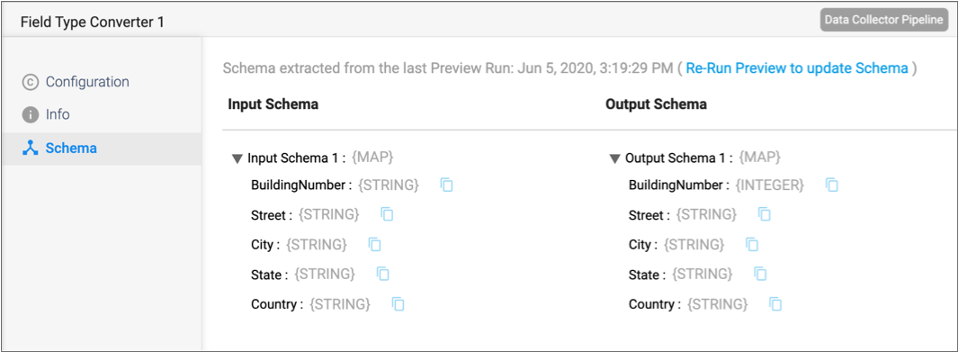
After running preview for a pipeline, you can view the input and output schema for each stage on the Schema tab in the pipeline properties panel. The schema includes each field path and data type.
- Invoke expression completion for a stage property.
- Click the Select Fields Using Preview Data icon to open the Field Selector dialog box for a stage property.
If you change the schema for a pipeline, for example if you remove a field, rename a field, or change the data type of a field, then you must run preview again so that the schema reflects the change.
In most cases as you configure stage properties, you can use expression completion or the Field Selector dialog box to specify a field path. However, in some cases, you might use the Schema tab to copy a field path.
For example, let’s say you are configuring a Field Type Converter processor to convert
the data type of a field by name. After running preview, you select the Field Type
Converter in the pipeline canvas, and then click the Schema tab in the pipeline
properties panel. You click the Copy Field Path to Clipboard icon
(![]() ) to copy the field path from the Schema tab, and then paste the field path into the
processor configuration.
) to copy the field path from the Schema tab, and then paste the field path into the
processor configuration.
The following image displays a sample Schema tab with the time of the last data preview:
Previewing a Single Stage
You can preview data for a single stage. In the Preview panel, you can review the values for each record to determine if the stage transforms data as expected.
-
Above the pipeline canvas, click the Preview icon:
 .
If the Preview icon is disabled, check the Validation Errors list for unconnected stages and required properties that are not defined.
.
If the Preview icon is disabled, check the Validation Errors list for unconnected stages and required properties that are not defined. -
In the Preview Configuration dialog box, configure the
following properties:
Preview Property Description Preview Source Source data for the preview: - Configured Source - Provides data from the origin system.
- Test Origin - Provides data from the test origin configured for the pipeline.
- Snapshot Data - Uses available snapshot data. Available for pipelines only.
Preview Batch Size Number of records to use in the preview. Honors values up to the Data Collector preview batch size. Default is 10. The Data Collector default is 10.
Preview Timeout Milliseconds to wait for preview data. Use to limit the time data preview waits for data to arrive at the origin. Relevant for transient origins only. Run Preview Through Stage Previews the pipeline up to the selected stage. Use to perform a partial preview when one of the stages encounters an error. For example, if preview fails because the Expression Evaluator processor encounters an error, run the preview up to the stage preceding the Expression Evaluator processor. Then you can view the preview data and correct the Expression Evaluator processor configuration as needed.
By default, previews all stages.
Time Zone Time zone used to display date, datetime, or time data. Default is the browser time zone.
Write to Destinations and Executors Determines whether the preview passes data to destinations or executors. By default, does not pass data to destination or executor stages.
Execute Pipeline Lifecycle Events Triggers the generation of any appropriate pipeline events, typically the Start event. If the event is configured to be used, event consumption is also triggered. Show Record/Field Header Displays record header attributes and field attributes when in List view. Attributes do not display in Table view. Show Field Type Displays the data type for fields in List view. Field types do not display in Table view. Save Preview Record Schema Determines whether the preview record schema is saved in the pipeline configuration. By default, the schema is not saved. When you close and then reopen the pipeline, the Schema tab for each pipeline stage is empty. You must run preview again to update the input and output schema.
When selected, the schema is saved after the pipeline is closed. However, be aware that saving the schema can cause the pipeline configuration to reach an excessive size, which in turn can cause a publish or export of the pipeline to fail.
Snapshot Data When using a snapshot for source data, select the snapshot to use. Remember the Configuration Stores the current preview configuration for use every time you request a preview for this pipeline. After you run data preview, you can change this option in the Preview panel by selecting the Preview Configuration icon (
 ) and clearing the
option. The change takes effect the next time you run
data preview.
) and clearing the
option. The change takes effect the next time you run
data preview. -
Click Run Preview.
The Preview panel highlights the origin stage and displays preview data in list view. Since this is the origin of the pipeline, no input data displays.
To view preview data in table view, click the Table View icon:
 .
. - To view data for the next stage, select the stage in the pipeline canvas.
-
To refresh the preview, click Reload
Preview.
Refreshing the preview provides a new set of data.
- To exit data preview, click Close Preview.
Previewing Multiple Stages
You can preview data for a group of linked stages within a pipeline.
When you preview multiple stages, you select the first stage and the last stage in the group. The Preview panel then displays the output data of the first stage in the group and the input data of the last stage in the group.
In the Preview panel, you can review the values for each record to determine if the group of stages transforms data as expected.
-
Above the pipeline canvas, click the Preview icon:
.
If the Preview icon is disabled, check the Validation Errors list for unconnected stages and required properties that are not defined.
-
In the Preview Configuration dialog box, configure the
following properties:
Preview Property Description Preview Source Source data for the preview: - Configured Source - Provides data from the origin system.
- Test Origin - Provides data from the test origin configured for the pipeline.
- Snapshot Data - Uses available snapshot data. Available for pipelines only.
Preview Batch Size Number of records to use in the preview. Honors values up to the Data Collector preview batch size. Default is 10. The Data Collector default is 10.
Preview Timeout Milliseconds to wait for preview data. Use to limit the time data preview waits for data to arrive at the origin. Relevant for transient origins only. Run Preview Through Stage Previews the pipeline up to the selected stage. Use to perform a partial preview when one of the stages encounters an error. For example, if preview fails because the Expression Evaluator processor encounters an error, run the preview up to the stage preceding the Expression Evaluator processor. Then you can view the preview data and correct the Expression Evaluator processor configuration as needed.
By default, previews all stages.
Time Zone Time zone used to display date, datetime, or time data. Default is the browser time zone.
Write to Destinations and Executors Determines whether the preview passes data to destinations or executors. By default, does not pass data to destination or executor stages.
Execute Pipeline Lifecycle Events Triggers the generation of any appropriate pipeline events, typically the Start event. If the event is configured to be used, event consumption is also triggered. Show Record/Field Header Displays record header attributes and field attributes when in List view. Attributes do not display in Table view. Show Field Type Displays the data type for fields in List view. Field types do not display in Table view. Save Preview Record Schema Determines whether the preview record schema is saved in the pipeline configuration. By default, the schema is not saved. When you close and then reopen the pipeline, the Schema tab for each pipeline stage is empty. You must run preview again to update the input and output schema.
When selected, the schema is saved after the pipeline is closed. However, be aware that saving the schema can cause the pipeline configuration to reach an excessive size, which in turn can cause a publish or export of the pipeline to fail.
Snapshot Data When using a snapshot for source data, select the snapshot to use. Remember the Configuration Stores the current preview configuration for use every time you request a preview for this pipeline. After you run data preview, you can change this option in the Preview panel by selecting the Preview Configuration icon (
) and clearing the
option. The change takes effect the next time you run
data preview. -
Click Run Preview.
The Preview panel highlights the origin stage and displays preview data in list view. Since this is the origin of the pipeline, no input data displays.
To view preview data in table view, click the Table View icon:
. -
To preview multiple stages, click Multiple.
The preview canvas highlights the first stage and the last stage, as follows:
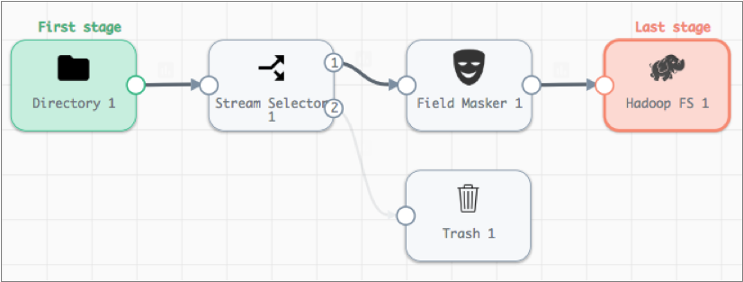
The Preview panel displays the input and output data for the selected group of stages. You can review the details of each record.
-
To change the first stage in the group, select the current first stage and then
select the desired stage.
For example, let's assume that you are previewing the pipeline displayed in the image above. To change the first stage, select Directory 1, the current first stage, and then select the desired first stage, such as Field Masker 1.
- To change the last stage in the group, select the current last stage and then select the desired stage.
-
To refresh the preview, click Reload
Preview.
Refreshing the preview provides a new set of data.
- To exit data preview, click Close Preview.
Editing Preview Data
You can edit preview data to view how a stage or group of stages processes the changed data. Edit preview data to test for data conditions that might not appear in the preview data set.
For example, when the stage filters integer data based on an expression, you might change the input data to test positive and negative integer values, as well as zero.
- The output data column for an origin.
- The input data column for processors.
When you edit preview data, you can pass the changed data through the pipeline, or you can revert your changes to return to the original data.
-
To change field values, in the Output Data column of an
origin or the Input Data column for all other stages, click
the value that you want to change and enter a new value.
You can edit values for any input data.
-
To process changed data, click Run With Changes.
This runs the data preview with the current set of data and stage configuration.In the Input Data column, records with changed values display with an asterisk and the changed values are highlighted. The Output Data column displays the results of processing. You can change and process preview data as often as necessary.
-
To refresh the preview, click Reload
Preview.
Refreshing the preview provides a new set of data.
- To revert changes to data, click Revert Data Changes.
Editing Properties
In data preview, you can edit stage properties to see how the changes affect preview data. For example, you might edit the expression in an Expression Evaluator to see how the expression alters data.
When you edit properties, you can test the change with the existing preview data or you can refresh the preview data.
-
To edit stage properties while in data preview, select the stage you want to
edit and click the Stage Configuration icon:
 .
.
- Change properties as needed.
-
To test properties changed in the origin, click Reload Preview.
This refreshes the preview data. Based on the origin type, it might use the same data or a new set of data with the updated origin properties.To test properties in any non-origin stage using the same set of data, click Run With Changes.
- If you want to revert your change, manually change the property back.