Control Hub User Interface
StreamSets Control Hub provides a web-based user interface (UI) for managing the pipeline repository and the execution components - including Data Collectors and TransformersData Collectors, Transformers, Provisioning Agents, and deployments. You can create connections, jobs, topologies, and Control Hub users, as well as administer your organization.
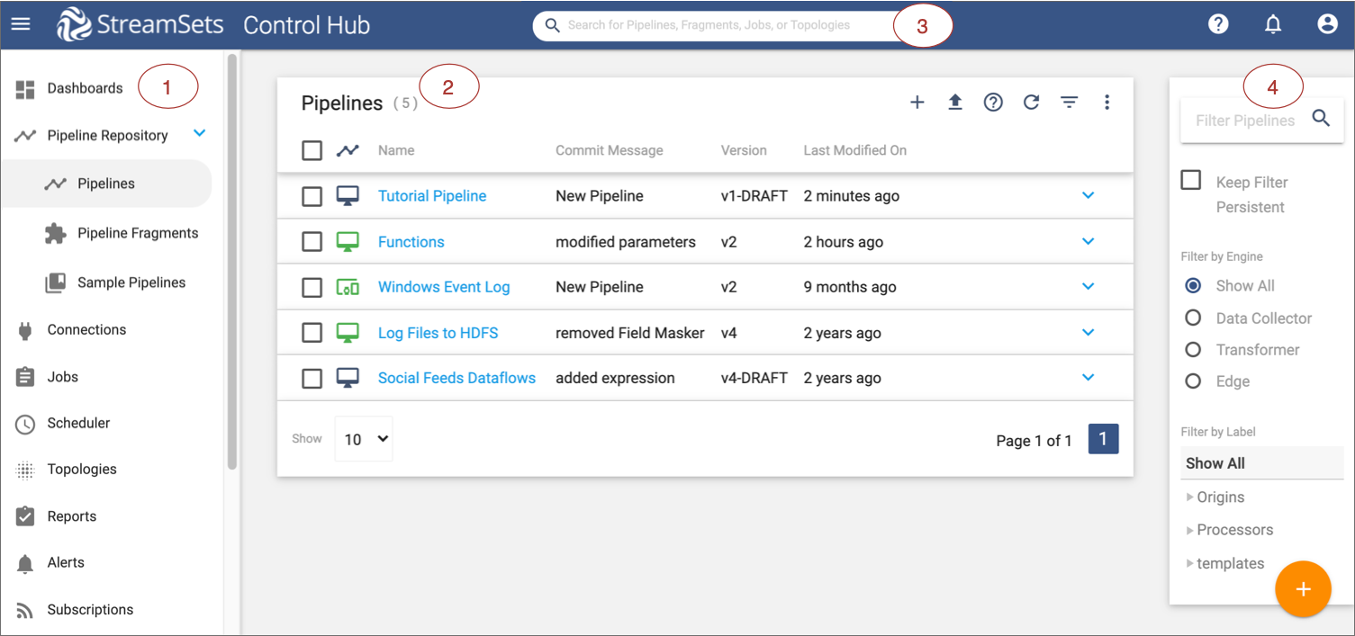
The Control Hub UI includes the following general areas and icons:
| Area/Icon | Name | Description |
|---|---|---|
| 1 | Navigation panel | Lists the areas that you can manage within Control Hub. |
| 2 | View | Displays one of the following views based on your selection in the
Navigation panel:
|
| 3 | Global search | Allows you to search for pipelines, pipeline fragments, jobs, and topologies by name. |
| 4 | Filter column | Allows you to filter the information displayed in the selected view. |
| Navigation Panel icon | Toggles the display of the Navigation panel. | |
| Help icon | Provides access to the online help and shows help tips. | |
| Alerts icon | Displays triggered alerts and a history of error messages. | |
| My Account icon | Displays your account details or logs you out. | |
| Toggle Filter Column icon | Toggles the display of the Filter column. | |
| Add icon | Adds objects - such as pipelines, jobs, or topologies - to the selected view. | |
| Import icon | Imports pipelines that have been exported from Control Hub, Data Collector, or Transformer. |
Dashboards
The Dashboards view provides access to the alerts and topologies dashboards.
Alerts Dashboard
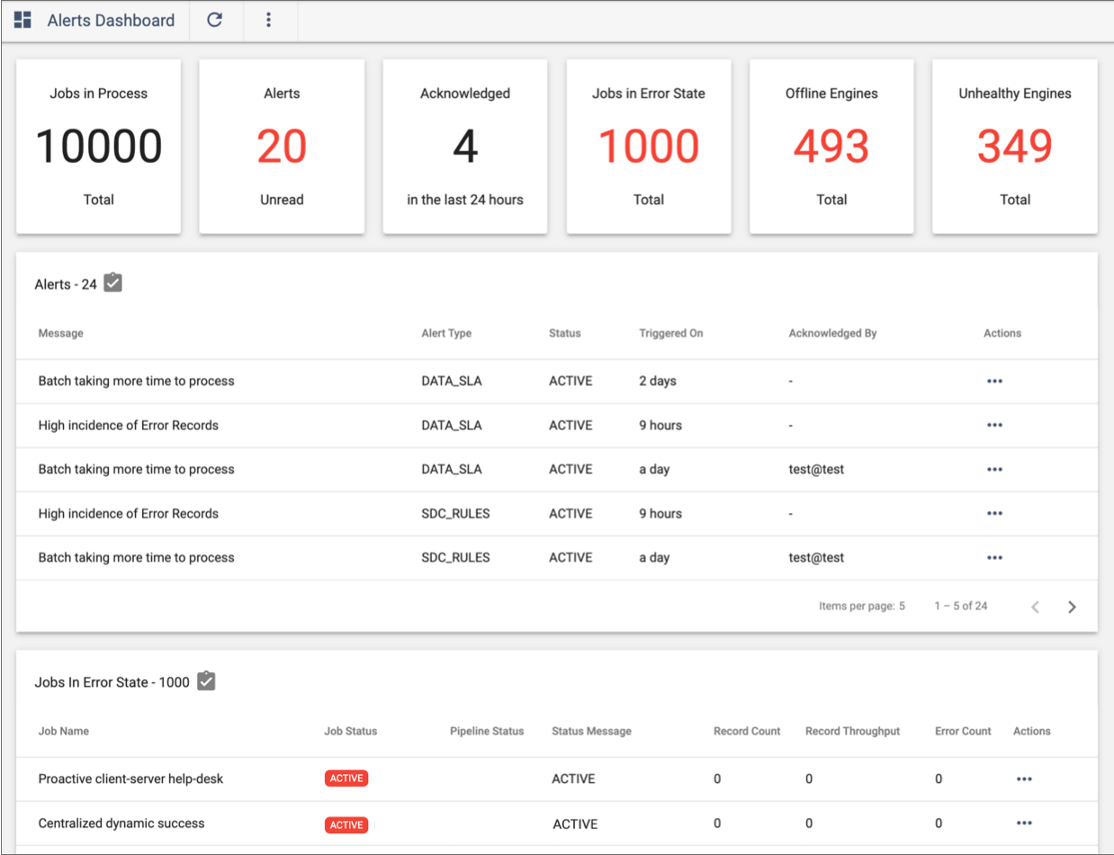
The Alerts Dashboard provides a summary of triggered alerts, jobs with errors, offline execution engines, and unhealthy engines that have exceeded their resource thresholds. Use the dashboard to monitor and troubleshoot jobs.
- Summaries
- Displays a summary of the number of active jobs, jobs with errors, active and acknowledged alerts, offline execution engines, and unhealthy engines that have exceeded their resource thresholds.
- Alerts list
- Displays a list of active and acknowledged data SLA and pipeline alerts. In
the Actions column for each listed alert, you can acknowledge the alert or
view the job for the alert. Click the Reports icon
(
 ) to view the data in a report.
 - Jobs in error state list
- Displays a list of jobs that have a red status, indicating that an error has
occurred that must be resolved. In the Actions column for each listed job,
you can view the job, job history, job logs, or pipeline included in the
job. Click the Reports icon ()
to view the data in a report.
- Engine summaries
- Displays a summary of execution engines, including the number of running engines and engines that have exceeded their maximum memory or CPU threshold.
- Offline or unhealthy engines list
- Displays a list of execution engines that are offline or that are unhealthy
because they have exceeded their resource thresholds. In the Actions column
for each listed engine, you can view the engine details. Click the
Reports icon ()
to view the data in a report.
- Engine charts
- Displays charts about the execution engines, including the most CPU and memory intensive engines.
The following image displays a sample alerts dashboard:
Topologies Dashboard
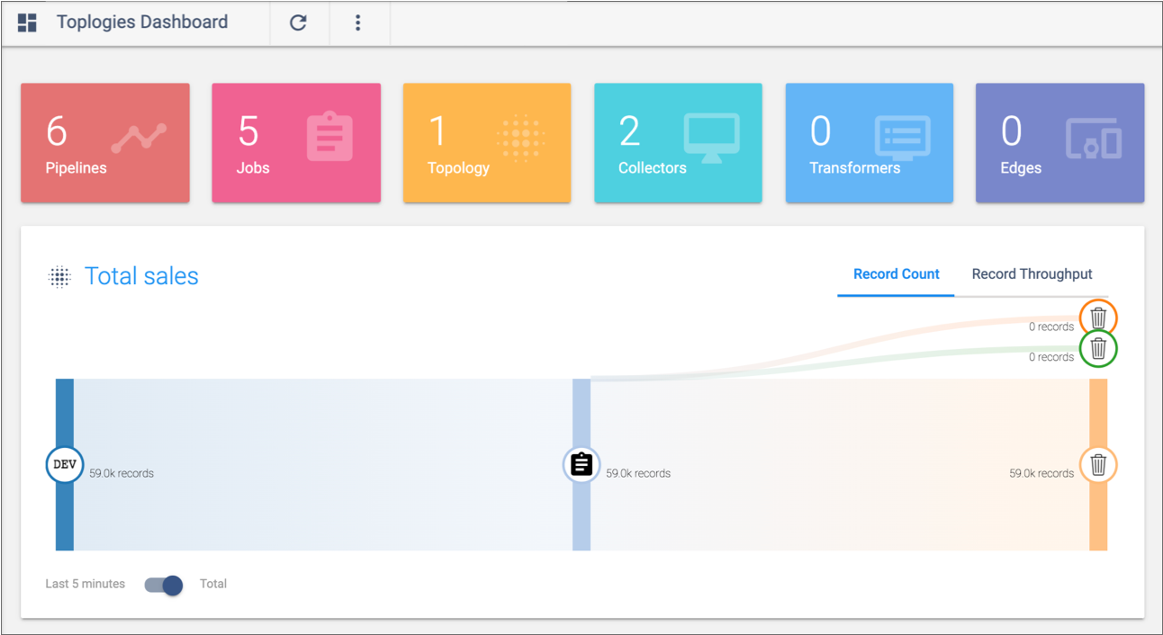
The Topologies Dashboard provides a summary of the number of pipelines, jobs, topologies, and execution engines that you have access to. If you have the Organization Administrator role, the dashboard also lists the number of users in your organization. The dashboard also displays the record count diagram for each topology.
Click one of the summaries to display the view for that object. Or click a topology record count diagram to view the details for that topology.
The following image displays a sample topologies dashboard:
Alerts
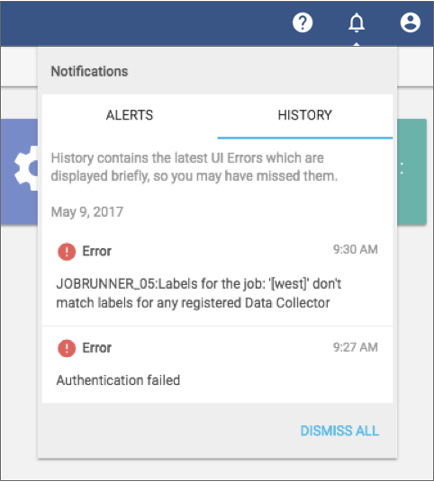
Alerts include data SLA and pipeline alerts that have been triggered and error messages that have briefly displayed in the UI. You can view both triggered alerts and a history of error messages when you click the Alerts icon. You can view details about triggered alerts from the Alerts view.
Click the Alerts icon (![]() ) in the top toolbar to view the following alerts:
) in the top toolbar to view the following alerts:
- Triggered data SLA and pipeline alerts - Displays all triggered alerts that have not
been acknowledged. Click an alert to manage the alert details.Note: If the defined alert text exceeds 255 characters, Control Hub truncates the text to 244 characters and adds a
[TRUNCATED]suffix to the text. - History of error messages - Displays recent error messages that briefly display in the UI. Click an error message to dismiss the message. Or, click Dismiss All to dismiss all of the messages.
The following image displays the history of error messages after clicking the Alerts icon:
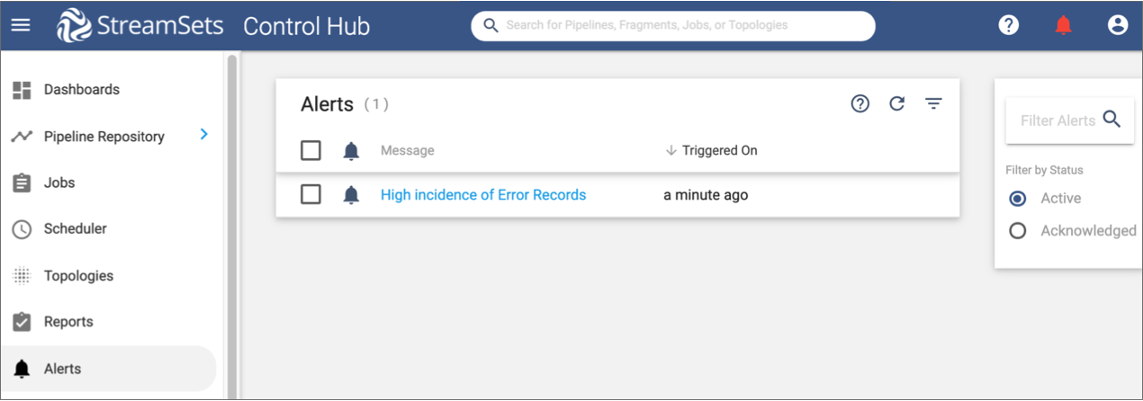
Click the Alerts view in the Navigation panel to view and acknowledge triggered alerts. You can filter the view by active or acknowledged alerts. Control Hub retains acknowledged alerts for 30 days, and then purges them.
The following image displays an active alert in the Alerts view:
My Account
Use the My Account window to review or update your account information.
To manage
your account, click in the Navigation panel. Or, click the My
Account icon (![]() ) and then click your user name.
) and then click your user name.
- View your Control Hub user ID and the organization that you belong to.
- Modify your display name or email address.
- Review your user roles.
User roles determine the tasks you can perform. Contact your organization administrator if you need to change your user roles.
- View the groups that you belong to.
- Update your password by clicking Update Password.