Basic Tutorial
The basic tutorial creates a pipeline that reads a file from an HTTP resource URL, processes the data in two branches, and writes all data to a file system. You'll use data preview to help configure the pipeline, then create a data alert and run the pipeline.
- Configure pipeline properties, primarily error handling.
- Add an HTTP Client origin to represent the data to be processed.
- Preview source data to determine the field-level details needed for the pipeline.
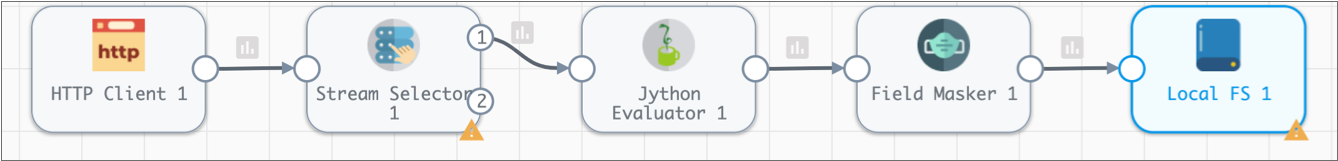
- Use a Stream Selector processor to route credit card transactions to the primary branch and cash transactions to the secondary branch. We'll define a required field to discard records without a payment type.
- Configure a Jython Evaluator processor to perform custom processing that determines the credit card type based on the credit card number.
- Add a Field Masker processor to mask credit card numbers. Use a required field to discard records without credit card numbers.
- Connect both branches to a Local FS destination.
- In the secondary branch, use an Expression Evaluator processor to add fields to the cash records to match the credit card records. Use data preview to verify the fields to add.
- Add a data rule to raise an alert if too many credit card payments are missing credit card numbers.
- Start the pipeline and monitor the results.
Create a Pipeline and Define Pipeline Properties
When you configure a pipeline, you need to decide what to do with error records. You can discard them or - more productively - write them to file, another pipeline, or a destination, like Amazon S3 or Azure Event Hub.
Write error records to one of these locations as a convenient way to review and reprocess with error records without having to stop the pipeline.
This tutorial writes the records to a local file.
- If necessary, log in to Control Hub.
- In the top toolbar, click .
- Enter the following name: Tutorial.
-
Use the defaults to create a blank Data Collector pipeline, and then
click Next.
By default, Control Hub selects an accessible authoring Data Collector that you have read permission on and that has the most recent reported time. To select another Data Collector, click Click here to select.
-
Click Save & Open in Canvas.
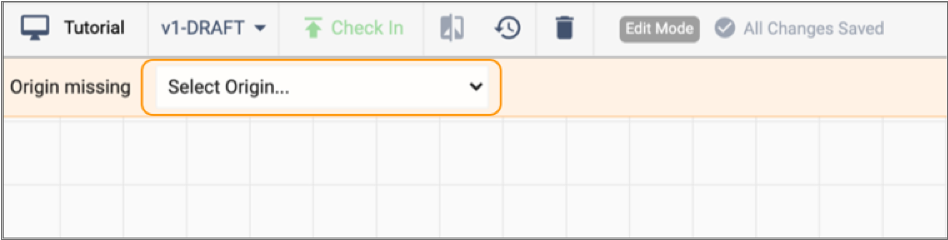
A blank pipeline opens in the canvas.
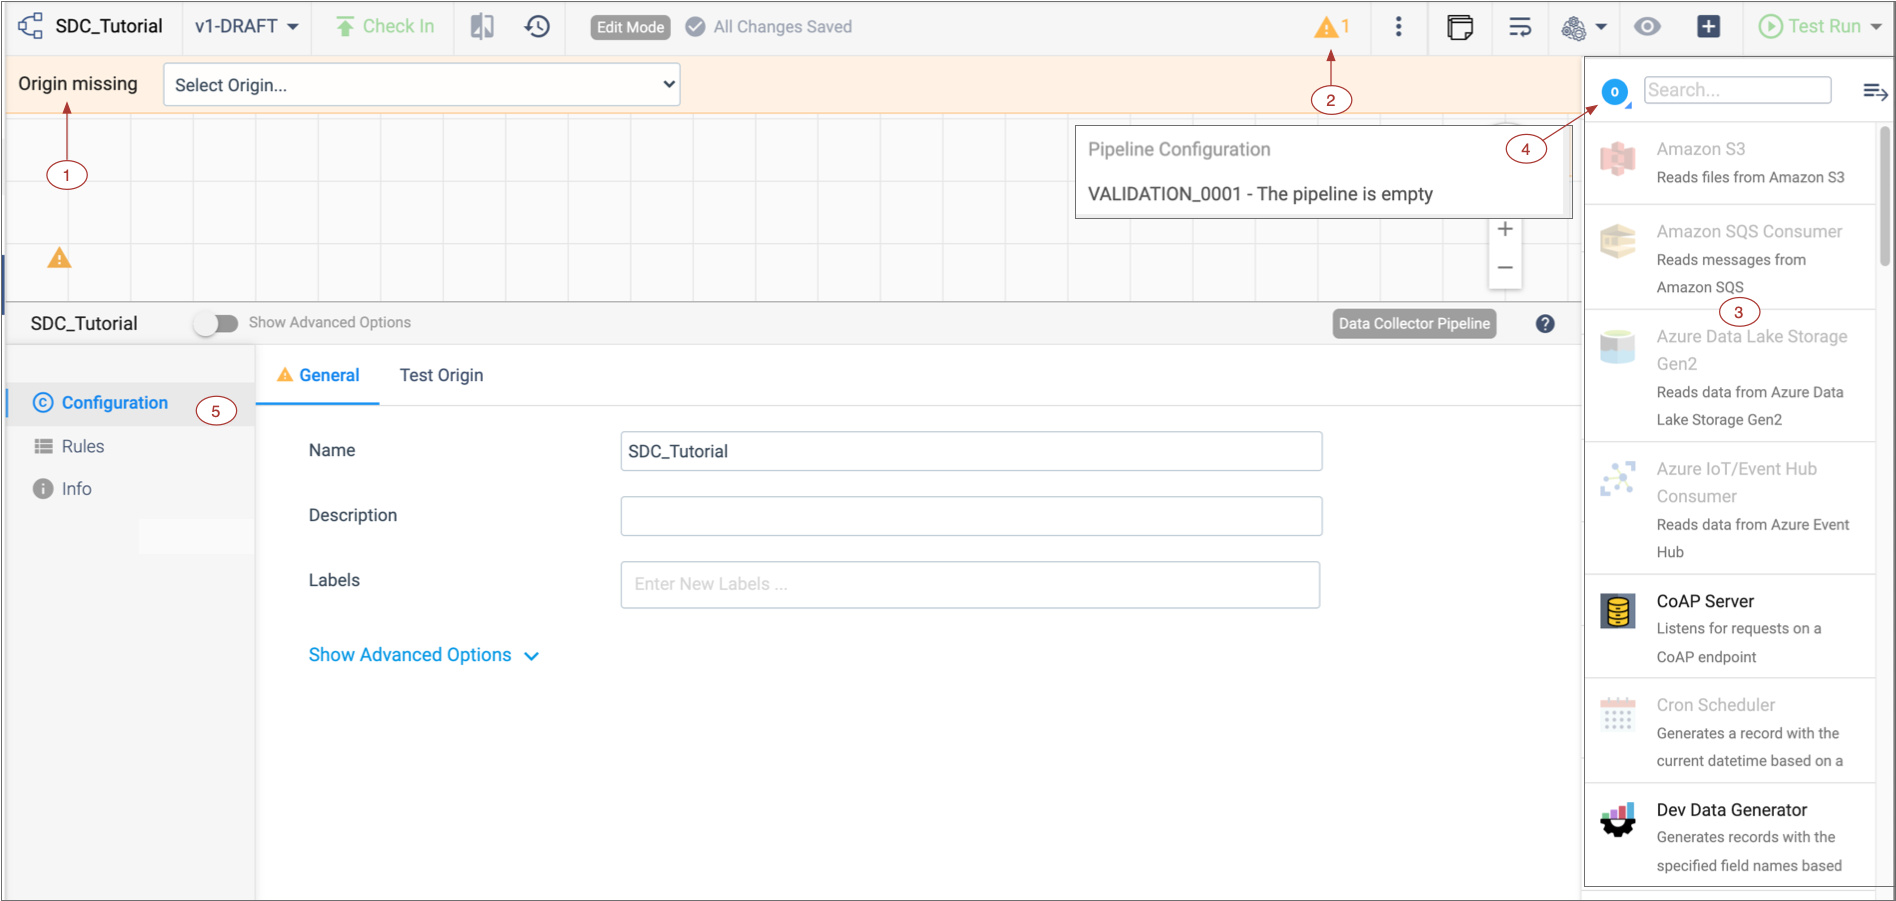 Note a few helpful areas:
Number Name Description 1 Pipeline Creation Help Bar Indicates that the origin is missing and offers a list of origins to choose from. If the Pipeline Creation Help Bar does not display, you might have disabled it. To enable it, in the top right corner of the Data Collector window, click the . Clear the Hide Pipeline Creation Help Bar option.
2 Issues icon Click to display the list of pipeline issues found by implicit validation. 3 Stage library panel Displays a list of available stages by default. 4 Stage menu Changes the stages that display in the stage library. 5 Properties panel / Preview panel / Monitor panel When you configure a pipeline, the Properties panel displays the properties of the pipeline or selected stage. You can resize, minimize and maximize the panel. When you preview data, the Preview panel displays the input and output data for the selected stage or group of stages.
When you monitor a running pipeline, the Monitor panel displays real-time metrics and statistics.
Note: Some icons and options might not display in the UI. The items that display are based on the task that you are performing and roles assigned to your user account.
Stage library icon Toggles the display of the stage library panel. 
Stage control icon Controls the stages that display in the stage library panel. In the image above, the panel displays only origins. This icon changes depending on the selection. The default icon (  ) indicates all types
of stages.
) indicates all types
of stages. -
In the Properties panel, click the Error Records tab. And
for the Error Records property, select Write
to File.
This writes error records to a file so you can deal with error records without having to stop the pipeline.
-
Click the Error Records - Write to File tab and configure
the following properties.
Use the defaults for properties that aren't listed:
Write to File Property Description Directory Directory for error record files. Enter the directory that you set up for the tutorial. We recommended: /<base directory>/tutorial/errorNote: To prevent validation errors, the directory must already exist.Files Prefix This defines a prefix for error record files. By default, the files are prefixed with "SDC" and an expression that returns the Data Collector ID, but that's more than we need here.
Delete the default and enter the following prefix: err_.
Max File Size For the tutorial, reduce the size of the files to something more manageable, such as 5 or 1 MB.
Now we'll start building the pipeline...
Configure the Origin
The origin represents the incoming data for the pipeline. When you configure the origin, you define how to connect to the origin system, the type of data to be processed, and other properties specific to the origin.
This tutorial builds a pipeline that reads a sample CSV file from an HTTP resource URL, processes the data to convert the data type of several fields, and then writes the data to a JSON file on your local machine.
The sample CSV file includes some invalid data, so you'll also see how IBM StreamSets handles errors when you preview the pipeline.
-
From the pipeline creation help bar, click , as follows:
The origin is added to the canvas.
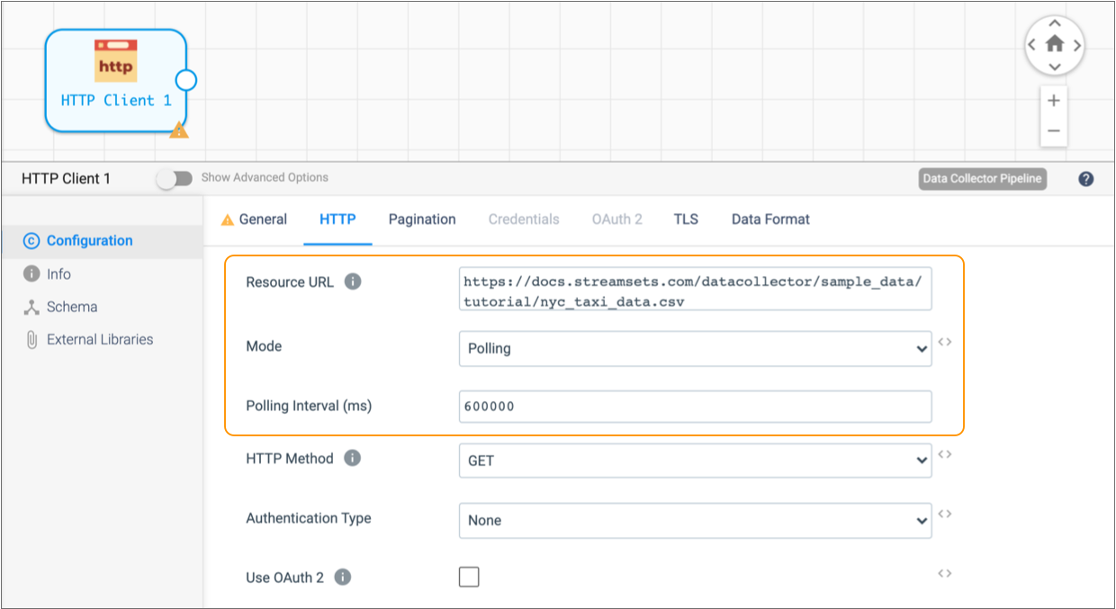
- In the properties panel below the canvas, click the HTTP tab.
-
Configure the HTTP properties as follows:
HTTP Property Value Resource URL https://docs.streamsets.com/datacollector/sample_data/tutorial/nyc_taxi_data.csvMode Polling Polling Interval 600000 Note: In most cases you would use batch mode to configure the origin to read a single file. In batch mode, the origin processes all available data and then stops the pipeline and job. However, when the origin uses batch mode to read a small amount of data, the Data Collector engine runs and stops the pipeline before you have a chance to monitor the data in real time. Setting the mode to polling with a 10 minute (or 600000 millisecond) interval causes the origin to read the full contents of the file, wait 10 minutes, and then read the contents of the file again. -
Use the default values for the remaining properties.
The HTTP tab should be configured as follows:
- Click the Data Format tab.
-
Configure the data format as follows:
Data Format Property Value Data Format Delimited Header Line With Header Line -
Use the default values for the remaining properties.
Since the sample data is read from a file, the origin reads all fields as strings.
Preview Data
To become more familiar with the data set and gather some important details for pipeline configuration, let's preview the source data.
- The field that contains payment information - We'll use this to route data in the Stream Selector processor.
- The field that contains credit card numbers - We'll use this to mask the data in the Field Masker processor.
When you access data in a field, you specify the field path for the field. The field
path depends on the complexity of the record: /<fieldname> for
simple records and <path to field>/<fieldname> for more
complex records.
Because we're using the List-Map root field type, we can use
/<fieldname>.
To start data preview, all stages must be connected and all required properties defined - though not necessarily correctly. Since the origin is configured and the only stage, the pipeline should be ready to preview as is.
-
Above the pipeline canvas, click the Preview icon:
 .
If the icon is not enabled, make sure you completed all the previous steps for the tutorial. If more than one issue displays in the list, correct any issue except Validation_0011.
.
If the icon is not enabled, make sure you completed all the previous steps for the tutorial. If more than one issue displays in the list, correct any issue except Validation_0011.Validation_0011 indicates that the HTTP Client origin isn't connected to anything yet and does not prevent data preview.
-
In the Preview Configuration dialog box, configure the
following properties.
Use the defaults for properties that aren't listed:
Data Preview Property Description Preview Source Use the default Configured Source to use the sample source data. Write to Destinations and Executors By default, this property is not selected. In general, you should keep this property clear to avoid writing data to destination systems or triggering tasks in destination systems. Show Field Type By default, this property is selected. Keep it selected to see the data type of fields in the record. Remember the Configuration Select to use these properties each time you run data preview. When you select this option, the UI enters data preview without showing this dialog box again.
-
Click Run Preview.
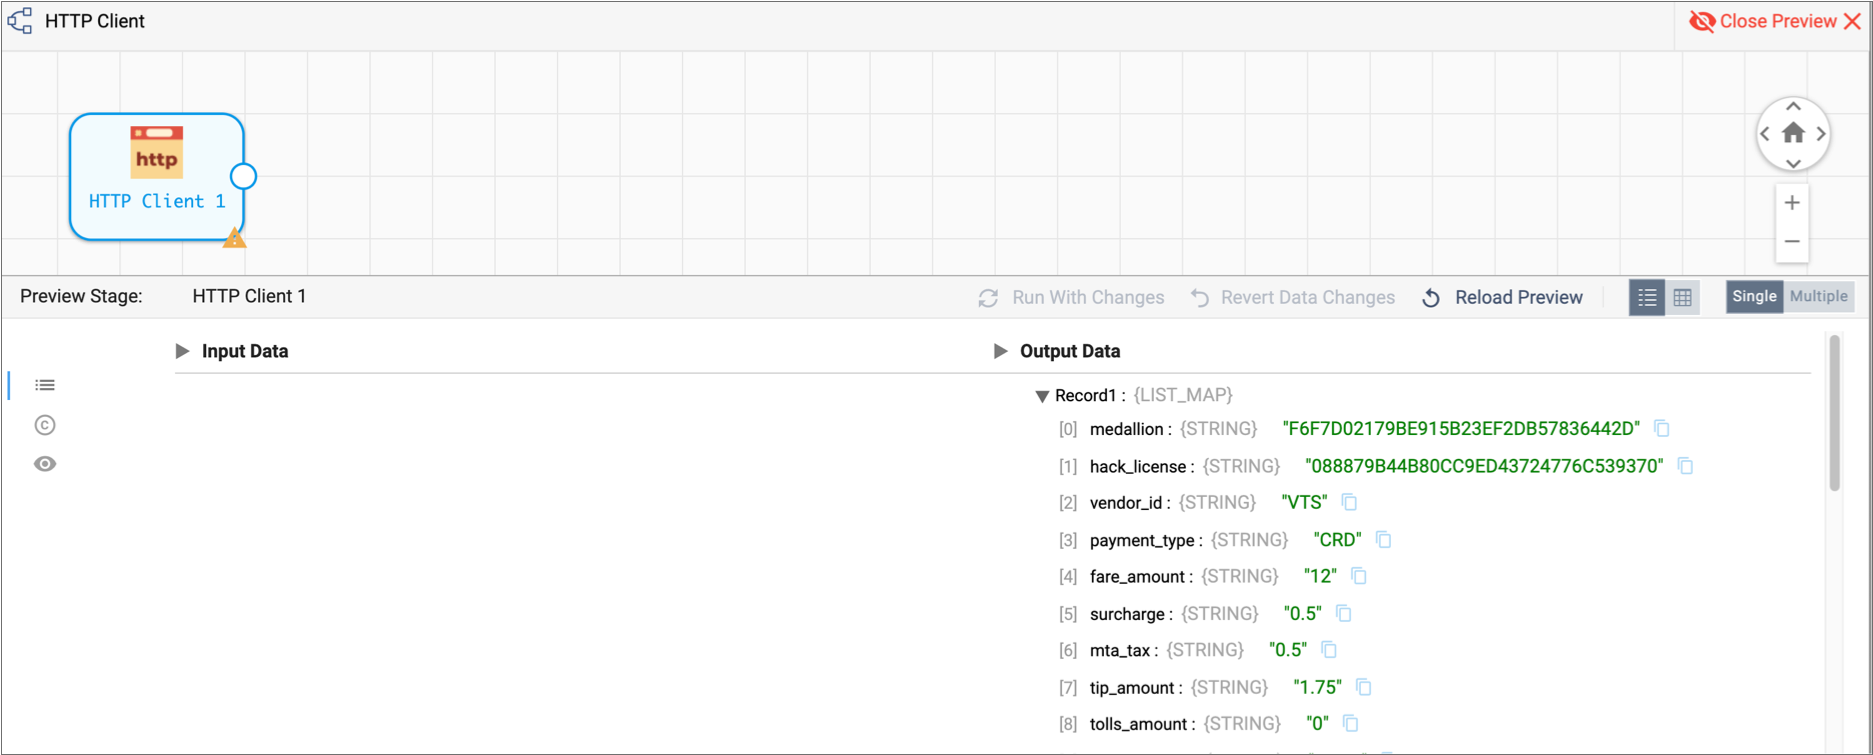
The Preview Panel displays a list of 10 output records for HTTP Client origin in list view. If you drill down a bit, you see that each record displays an ordered list of field names and values with the data type of each field.
Because the data is read from a file, all fields are strings:
Note that in the Preview panel, the preview records display on the Records tab:
 . To review or change properties, use the Stage
Configuration tab:
. To review or change properties, use the Stage
Configuration tab:  . To change preview properties, use the Preview
Configuration tab:
. To change preview properties, use the Preview
Configuration tab:  .
. -
For a full view of the data, click the Table View icon:
 .
The Preview panel displays the first several columns of data.
.
The Preview panel displays the first several columns of data.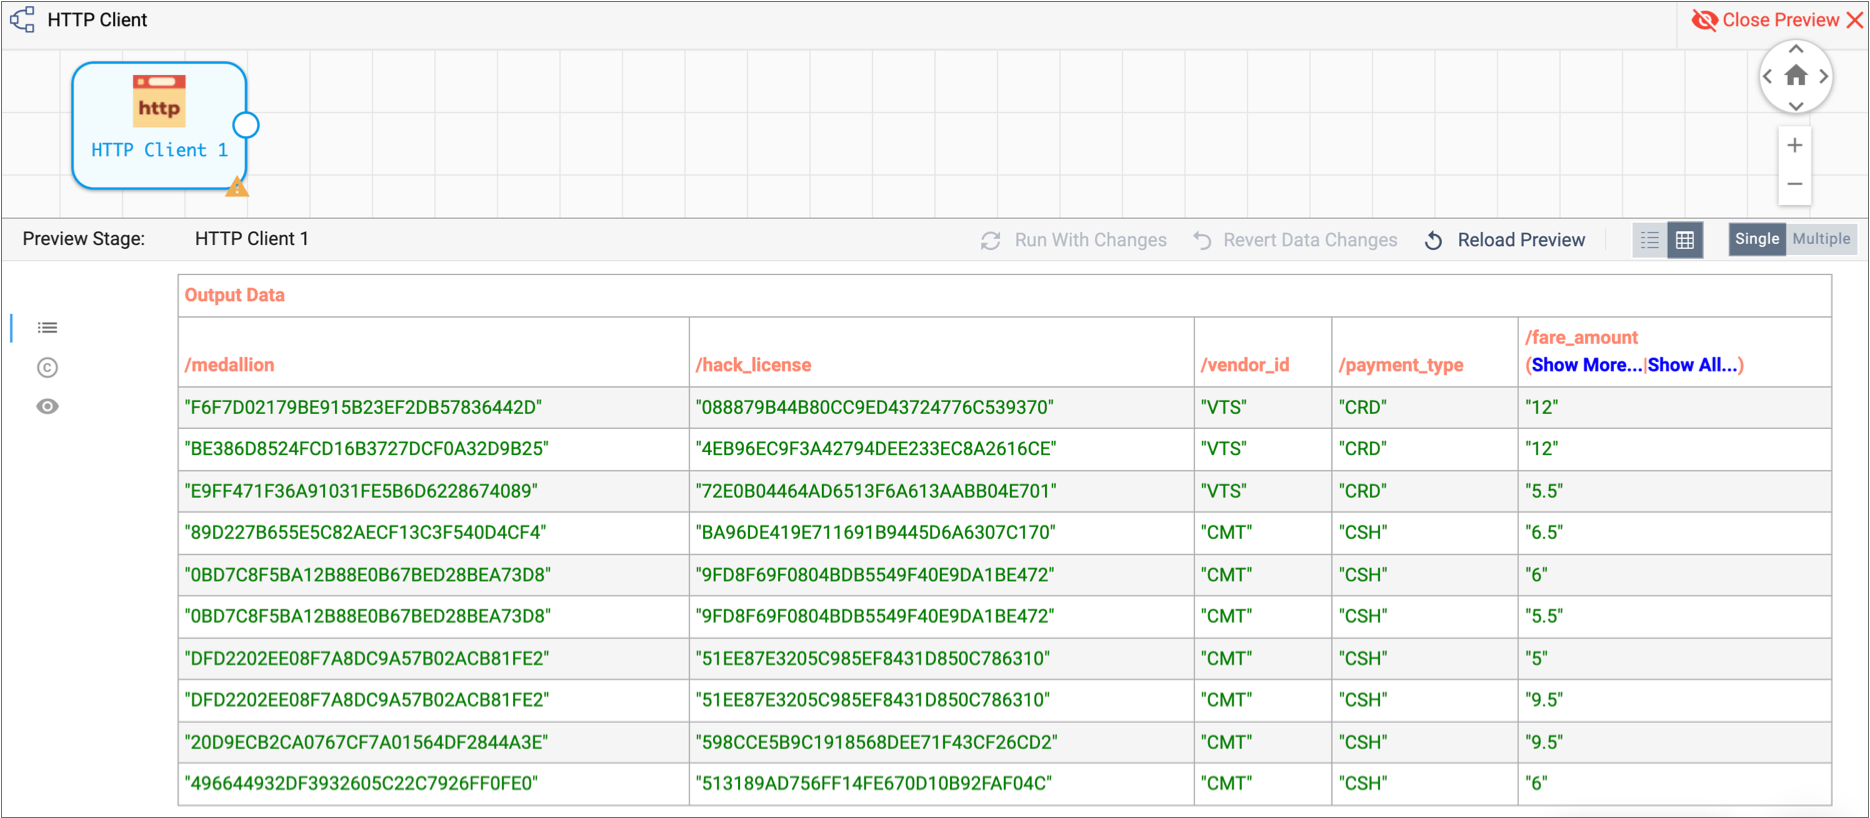
-
To view all columns, click Show All.
If you scroll to the right, you can verify that the
credit_cardfield contains credit card numbers for the first three records. When you scroll back to thepayment_typefield, notice this corresponds to records where the payment type isCRD. -
Now that we have the information that we need, click the Close
Preview icon:
 .
.
- Payment type information is in the
payment_typefield and credit card information is in thecredit_cardfield. - To use these fields in expressions, we'll use their field paths:
/payment_typeand/credit_card. - To route records paid by credit card, we'll look for records where the payment
type is
CRD.
Route Data with the Stream Selector
To route data to different streams for processing, we use the Stream Selector processor.
The Stream Selector processor routes data to different streams based on user-defined conditions. Any data not captured by a user-defined condition routes to the default stream.
We'll route credit card transactions to a credit card stream for processing. All other transactions will go to the default stream.
We'll also define a required field to drop records with no payment type. When you define a required field, a record must include data for the specified field to enter the stage. Records that don't include data in required fields are sent to the pipeline for error handling. If you configured the pipeline to write to file, that's where error records go.
To represent data in a field, we use therecord:value function. This returns field values associated with
the field.${record:value('/payment_type') == 'CRD'}Note that we enclose expressions in a dollar sign and curly brackets. You can use single or double quotation marks around strings. For more information about the expression language, see Expression Language.
-
From the Pipeline Creation Help Bar, click . Or, in the Stage Library panel, select the Stream
Selector processor (
 ) and connect the HTTP Client origin to
it.
) and connect the HTTP Client origin to
it.
-
On the General tab, click in the Required
Fields text box.
A list of available fields displays because you already performed data preview. It also displays when the pipeline is valid for data preview.
-
To discard records with no payment type information, click Advanced
Options and select the following field:
/payment_type.If a list does not appear, you can manually enter the field path:/payment_type. -
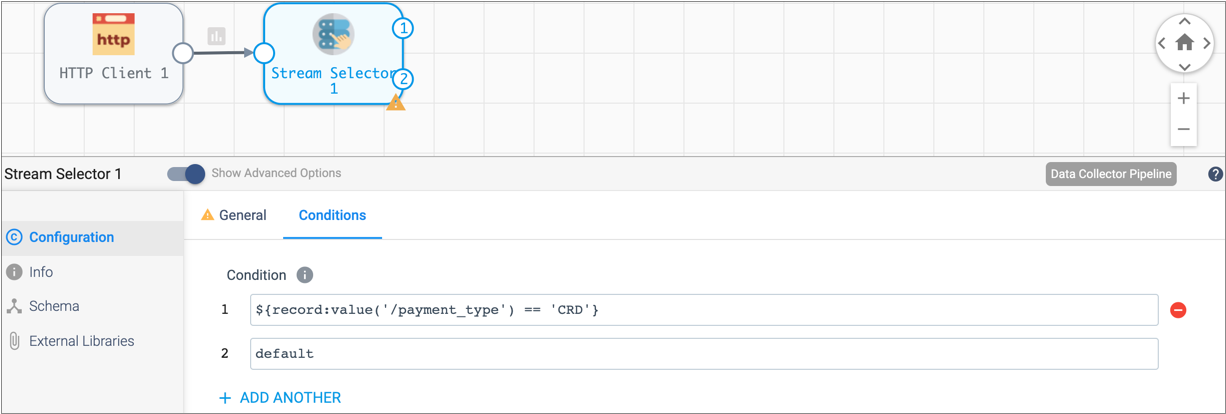
To configure the Stream Selector processor condition, click the
Conditions tab.
A condition for the default stream displays. The default stream represents any records not captured by other conditions.
-
Click the Add icon:
 .
A condition text box displays in the Property panel, and the corresponding output location appears on the stage in the canvas.
.
A condition text box displays in the Property panel, and the corresponding output location appears on the stage in the canvas. -
The following condition captures records where a credit card is used for
payment. You can copy and paste the expression, but try typing it in to see how
the expression completion feature helps you select the function and ensure valid
syntax.
${record:value('/payment_type') == 'CRD'}All records that match this condition pass to the first output stream. All other records are captured by the default condition and passed through the second output stream.
Use Jython for Card Typing
Next, we'll evaluate credit card numbers to determine the credit card type. You can use an Expression Evaluator processor to do the same calculations, but with a short script, the Jython Evaluator processor is easier.
You can use custom scripts with the JavaScript Evaluator and the Jython Evaluator processors to perform processing that is not easily performed using other Data Collector processors. When using scripts to handle list-map data, the script must treat the data as maps.
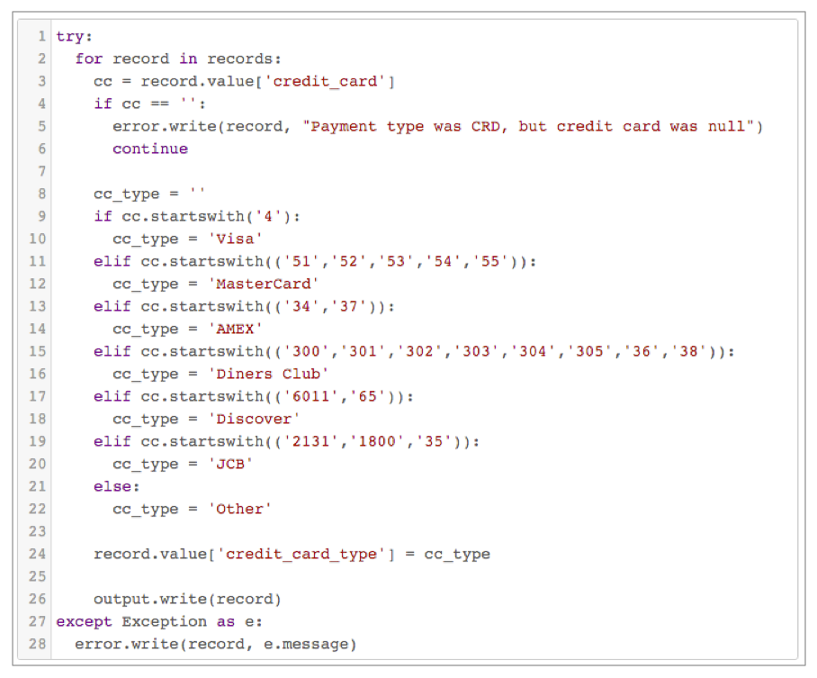
The Jython script that we provide creates an additional field,
credit_card_type, and generates the credit card type by
evaluating the first few digits of the credit card number. The script returns an
error message if the record has a credit card payment type without a corresponding
credit card number.
-
Add a Jython Evaluator processor to the canvas.
If the Jython Evaluator processor isn’t listed in the stage library, you’ll need to install the Jython stage library first.
-
Connect the first output location of the Stream Selector processor to the
Jython Evaluator processor.
This routes records paid by credit card to the Jython Evaluator processor.
- With the Jython Evaluator processor selected, in the Properties panel, click the Jython tab.
- In the Advanced tab, use the default Batch by Batch record processing mode to process data in batches, instead of record by record.
-
In the Script text box, review the information in the
comments, then delete it. Paste in the following script:
try:
  for record in records:
    cc = record.value['credit_card']
    if cc == '':
      error.write(record, "Payment type was CRD, but credit card was null")
      continue

    cc_type = ''
    if cc.startswith('4'):
      cc_type = 'Visa'
    elif cc.startswith(('51','52','53','54','55')):
      cc_type = 'MasterCard'
    elif cc.startswith(('34','37')):
      cc_type = 'AMEX'
    elif cc.startswith(('300','301','302','303','304','305','36','38')):
      cc_type = 'Diners Club'
    elif cc.startswith(('6011','65')):
      cc_type = 'Discover'
    elif cc.startswith(('2131','1800','35')):
      cc_type = 'JCB'
    else:
      cc_type = 'Other'

    record.value['credit_card_type'] = cc_type

    output.write(record)
except Exception as e:
  error.write(record, e.message)
Note: Incorrect indentation can cause Jython validation errors. For best results, copy the script from the online help. Copying the script from the PDF can result in incorrect indentation.To launch context-sensitive help, click the Help icon in the Properties panel. Then in the table of contents, scroll down to find the Data Collector Tutorial chapter > Basic Tutorial > Use Jython for Card Typing.
Mask Credit Card Numbers
Now let's prevent sensitive information from reaching internal databases by using a Field Masker processor to mask the credit card numbers.
The Field Masker processor provides fixed and variable-length masks to mask all data in a field. To reveal specified positions in the data, you can use custom masking. To reveal a group of positions within the data, you can use a regular expression mask to define the structure of the data and then reveal one or more groups.
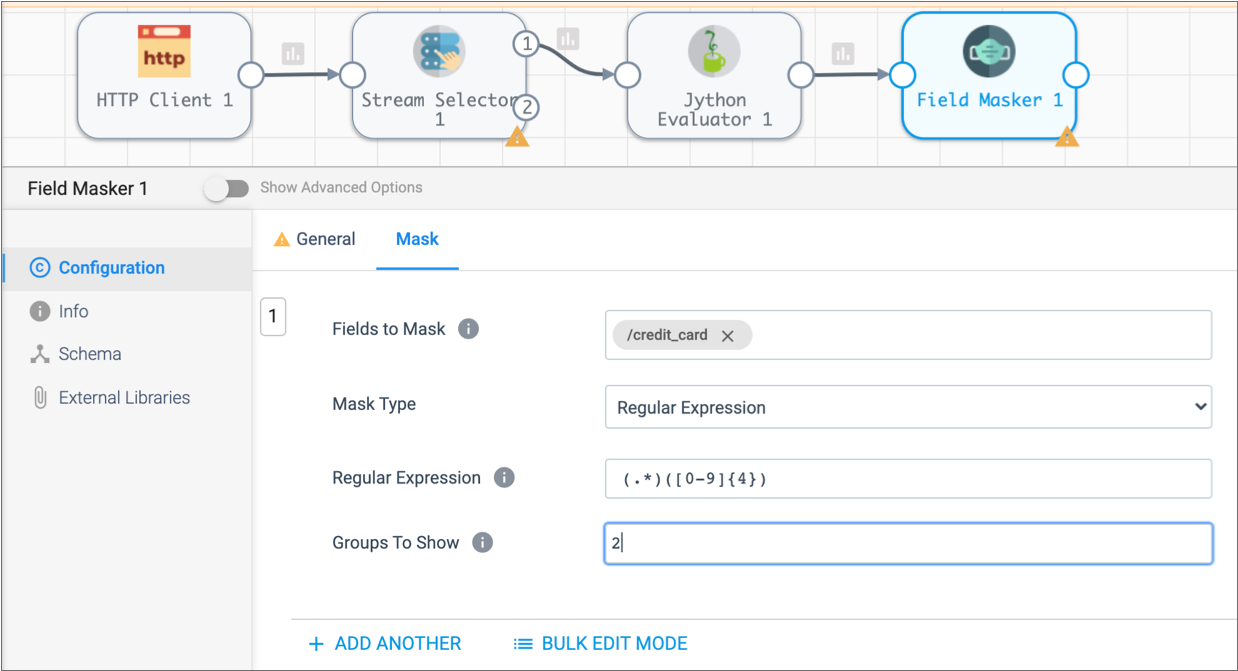
(.*)([0-9]{4})The regular expression defines two groups so we can reveal the second group.
- Add a Field Masker processor to the canvas and connect the Jython Evaluator processor to it.
- In the Properties panel, click the Mask tab.
- Click in the Fields to Mask field and enter the field /credit_card.
-
To use a regular expression as a mask and display the last 4 digits of the
credit card number, configure the rest of the properties as follows:
Field Masker Property Value Mask Type Regular Expression Regular Expression (.*)([0-9]{4})Groups to Show 2
Write to the Destination
Data Collector can write data to many destinations. The Local FS destination writes to files in a local file system.
When you configure the Local FS destination, you define the directory template. This determines the naming convention for the output directories that are created.
- Add a Local FS destination to the canvas and connect the Field Masker processor to it.
-
Click the Output Files tab, click Show Advanced
Properties, and then configure the following properties.
Use the defaults for properties that aren't listed:
Local FS Property Configuration Directory Template By default, the directory template includes datetime variables to create a directory structure for output files. This is intended for writing large volumes of data. Since we only have the sample file to process, we don't need the datetime variables. Go ahead and delete the default and enter the directory where you want the files to be written.
We suggest:
/<base directory>/tutorial/destination.Files Prefix Defines a prefix for output file names. By default, the files are prefixed with "SDC" and an expression that returns the Data Collector ID, but that's more than we need here.
Let's simplify and use out_ instead.Max File Size (MB) For the tutorial, let's lower the file size to something manageable, like 5 or 1. -
Click the Data Format tab, and configure the following
properties.
Use the defaults for properties that aren't listed:
Delimited Property Value Data Format Delimited Header Line With Header Line
Now, we'll go back to the Stream Selector processor and complete the secondary branch.
Add a Corresponding Field with the Expression Evaluator
The Jython Evaluator script added a new field to the credit payments branch. To ensure all records have the same structure, we'll use the Expression Evaluator processor to add the same field to the non-credit branch.
This ensures that all records have the same format when written to the destination.
To do this, let's use data preview to verify how the Jython Evaluator processor adds the credit card type to records.
-
Click the Preview icon: .
- In the Preview Configuration window, click Run Preview.
- In the pipeline, click the Jython Evaluator processor to view its output.
-
Expand the first output record, scroll down, and notice the new field
highlighted in green:
/credit_card_type.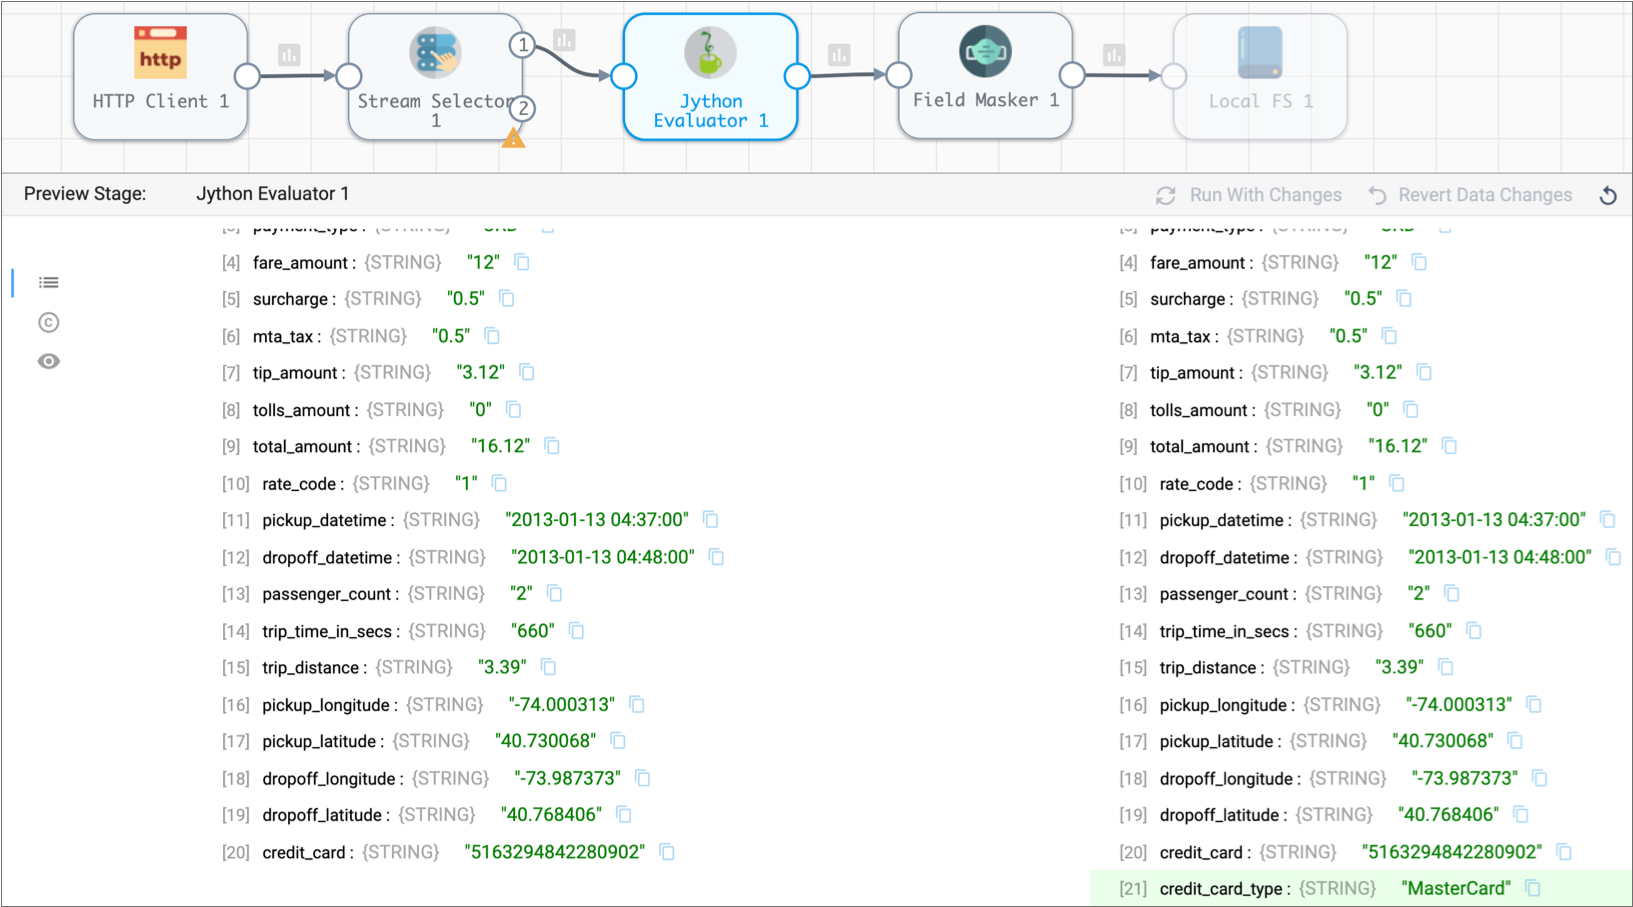
- Click Close Preview.
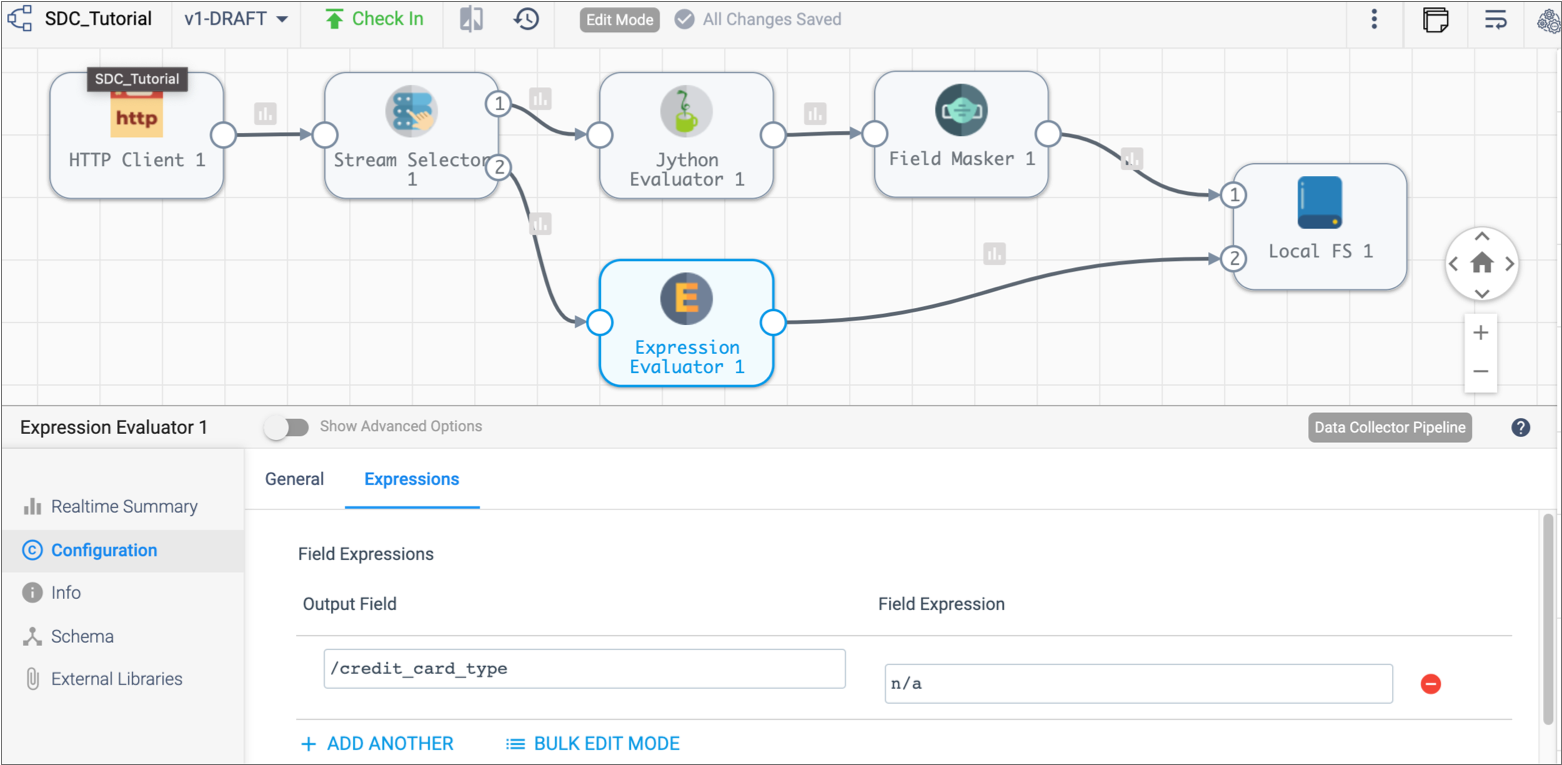
- Add an Expression Evaluator processor to the canvas and connect the second, default stream of the Stream Selector processor to it.
- Click the Expressions tab.
-
Configure the following Field Expression
properties:
Output Field Value /credit_card_typen/a This creates acredit_card_typefield that indicates the information is not applicable.Since we're usingn/aas a constant for the expression, we don't need to use the dollar sign and brackets for the expression. But if we wanted to use them, we could define them as${'credit_card_type'}and${'N/A'}. -
Link the Expression Evaluator processor to the Local FS destination.
This streams the data from this branch to the destination, merging data from both branches:
Create a Data Rule and Alert
Now before we run the basic pipeline, let's add a data rule and alert. Data rules are user-defined rules used to inspect data moving between two stages. They are a powerful way to look for outliers and anomalous data.
Data rules and alerts require a detailed understanding of the data passing through the pipeline. For more general pipeline monitoring information, you can use metric rules and alerts.
The script in the Jython Evaluator processor creates error records for credit card transactions without credit card numbers. We can create a data rule and alert to let us know when the record count reaches a specified threshold.
We'll use an expression with the record:value() function to identify
when the credit card number field, /credit_card, is null. The
function returns the data in the specified field.
-
Between the Stream Selector and the Jython
Evaluator processors, select the link or Data Inspection icon:
 .
The Data Rules tab displays in the Preview panel.
.
The Data Rules tab displays in the Preview panel. - Click Add.
-
In the Data Rule dialog box, configure the following
properties.
Use the defaults for properties that aren't listed:
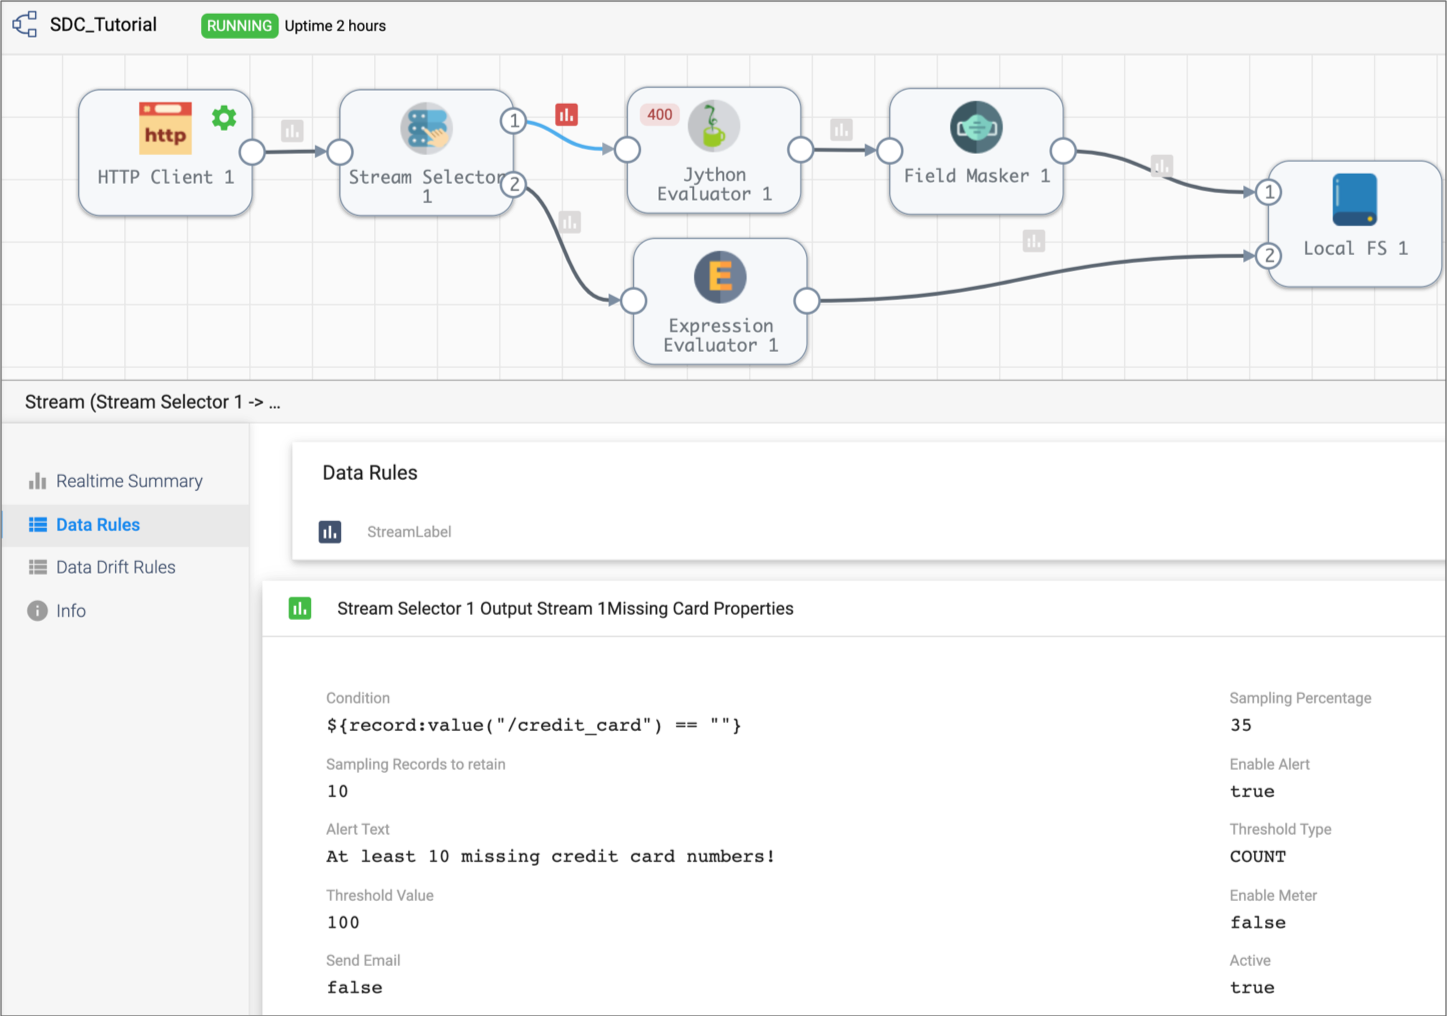
Data Rule Property Value Label Missing Card Numbers Condition ${record:value("/credit_card") == ""} Sampling Percentage 35 Alert Text At least 10 missing credit card numbers! Threshold Value 10 This creates an alert that is triggered after finding ten records that don't include credit card numbers in the credit card payment stream.
Note: With a larger data set, a smaller sampling percentage and higher threshold value might be appropriate, but we'll use these numbers for the purposes of the tutorial. -
Click Save.
The rule displays in the data rule list. And the Data Inspection icon darkens to show that a data rule is configured for the stream.
-
To enable the data rule and alert, click Enable.
Notice the Data Inspection icon becomes a darker grey to show that a data rule is active on the stream.
Run the Basic Pipeline
The UI enters Monitor mode and shows summary statistics in the Monitor panel. At some point as the pipeline runs, the data alert triggers and the location of the triggered data alert turns red.
Click the Data Alert icon to view the data alert notification. Then, close the notification and explore the information available in the Monitor panel.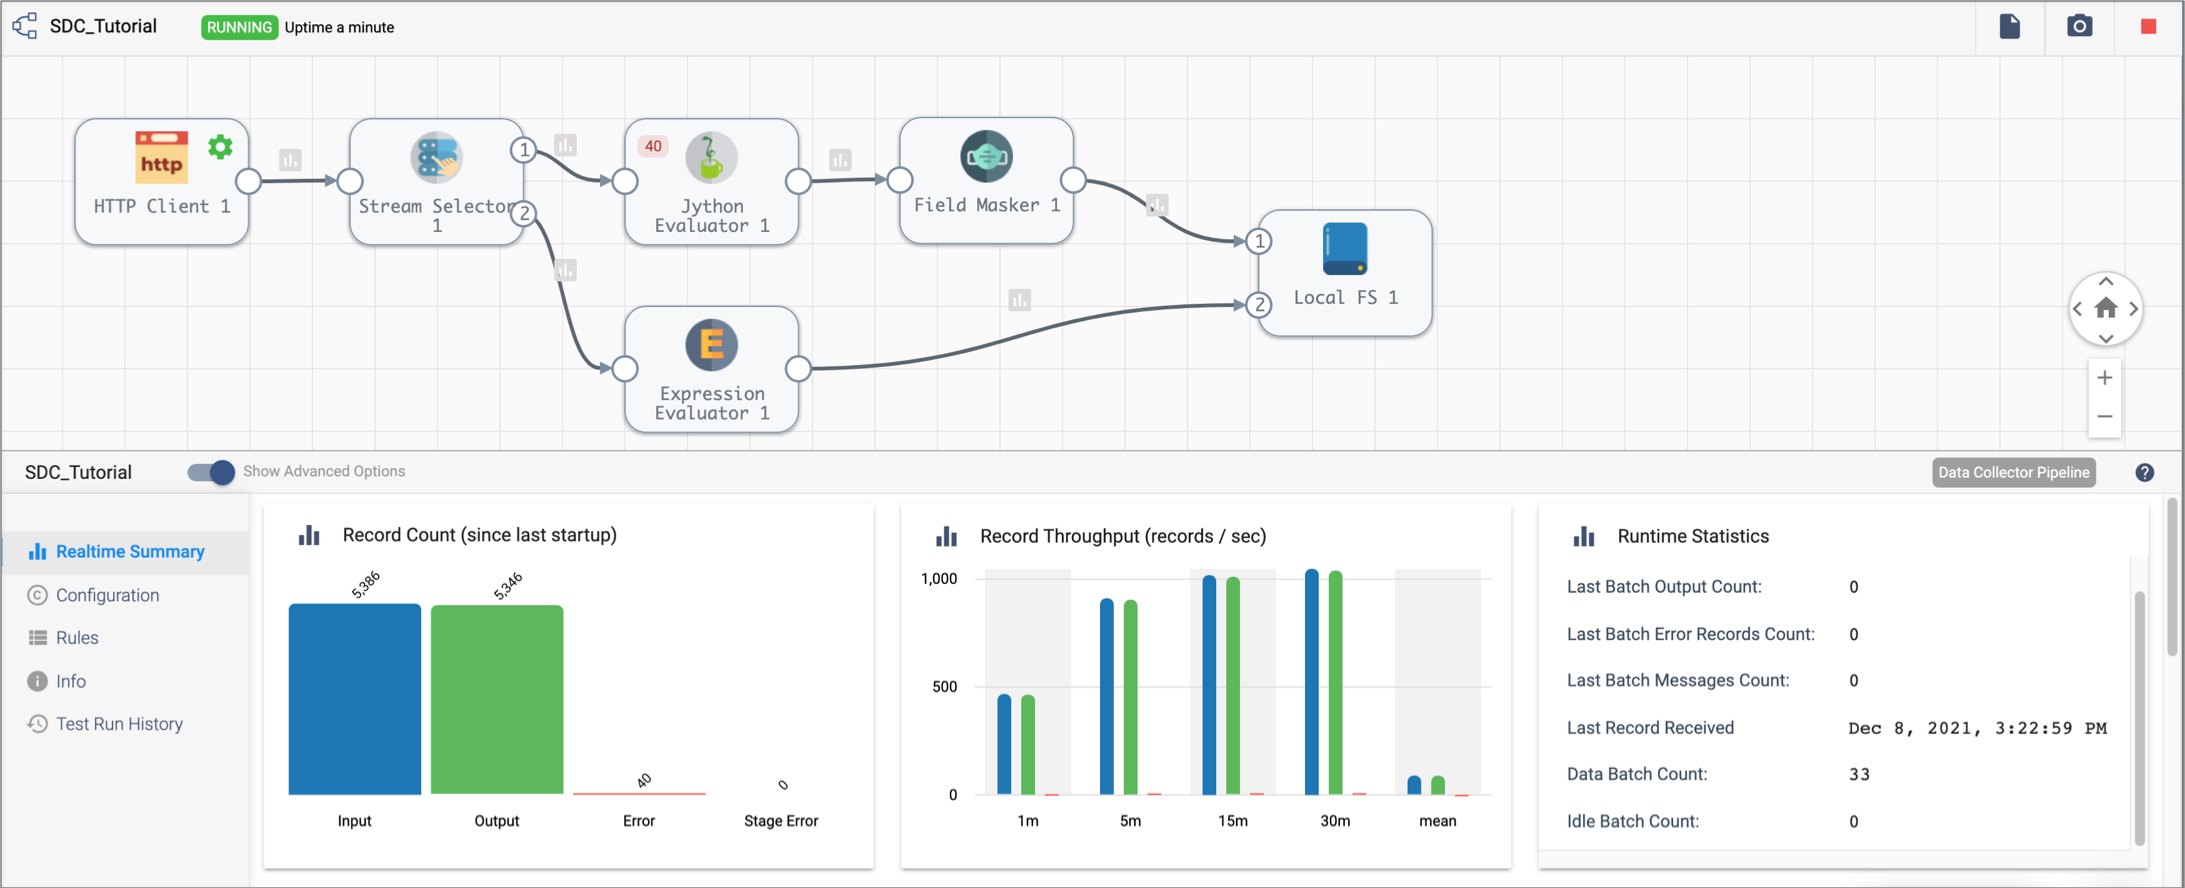
Note that when you select an unused part of the canvas, the Monitor panel displays monitoring information for the entire pipeline. When you select a stage, it displays information for the stage.
The Jython Evaluator processor shows 40 error records. Click the error records number to see the list of cached error records and related error messages.
You can also select the red Data Inspection icon to view information about the data alert and view the error records associated with the data alert.
In the Extended Tutorial, we'll add more stages and see more data transformations. We can use data preview to step through the pipeline to review how each stage processes the data.