Preview
Overview
You can preview data to help build or fine-tune a pipeline. You can preview complete or incomplete pipelines.
When you preview data, source data from the origin passes through the pipeline, allowing you to review how the data passes and changes through each stage. You can edit stage properties and run the preview again to see how your changes affect the data.
You can choose to preview using Spark libraries embedded in the Transformer installation or using the Spark cluster configured for the pipeline.
You can preview all stages in the pipeline, or you can perform a partial preview when one of the pipeline stages encounters an error. You can preview data for one stage at a time or for a group of stages. You can also view the preview data in list or table view.
When previewing data for a processor, you can choose how to display the order of output records. You can display output records in the order that matches the input records or in the order produced by the processor.
After running preview, you can view the input and output schema for each stage on the Schema tab in the pipeline properties panel.
Preview Availability
You can preview complete and incomplete pipelines.
The Preview icon (![]() ) becomes
active when preview is available. You can preview data under the following
conditions:
) becomes
active when preview is available. You can preview data under the following
conditions:
- The authoring Transformer is an available registered Transformer.
- All stages in the pipeline are connected.
- All required properties are defined.
Spark for Preview
- Embedded Spark libraries
- Transformer includes embedded Spark libraries that you can use to preview a local or cluster pipeline.
- Spark cluster configured for the pipeline
- Transformer previews the pipeline using the Spark cluster configured for the pipeline.
In most cases, you'll want to preview using the configured Spark cluster so that Transformer uses the same processing as when you run the pipeline. However, if you want to quickly test pipeline logic that doesn't require using the source data from the origin, you can use development origins and then preview the pipeline using the embedded Spark libraries.
Writing to Destinations
As a tool for development, preview does not write data to destinations by default.
If you like, you can configure the preview to write data to destinations. We advise against writing preview data to production destinations.
Preview Data Types
MMM d, y h:mm:ss
a.Preview Codes
In Preview mode, Transformer displays different colors for different types of data. Transformer uses other codes and formatting to highlight changed fields.
| Preview Code | Description |
|---|---|
| Black values | Date data |
| Blue values | Numeric data |
| Green values | String data |
| Red values | Boolean data |
| Light red background | Fields removed by a stage |
| Green stage | First stage in a multiple-stage preview |
| Red stage | Last stage in a multiple-stage preview |
Processor Output Order
When previewing data for a processor, you can preview both the input and the output data. You can display the output records in the order that matches the input records or in the order produced by the processor.
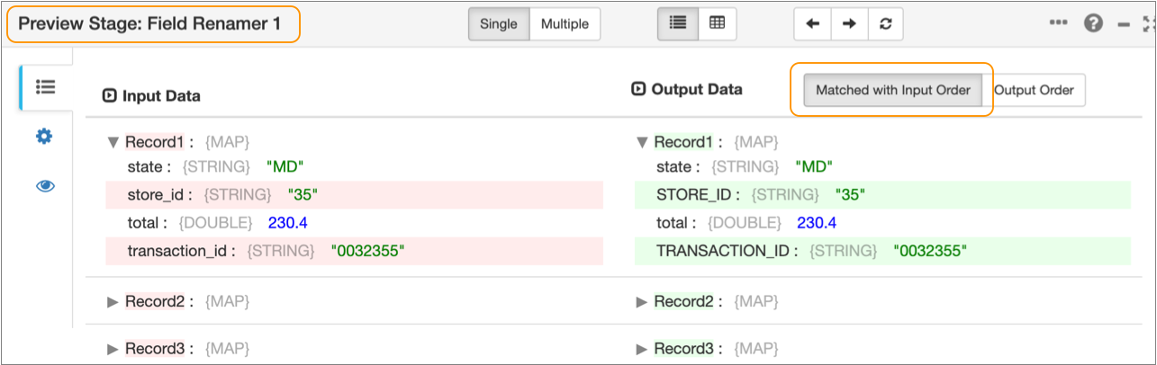
In most cases when you preview data for a processor, you'll want to compare matching input and output records side by side because the processor produces updated records. For example, when you preview data for a Field Renamer processor, Transformer by default displays the output records in matching order with the input records. The Preview panel highlights the changed field in each record, as follows:
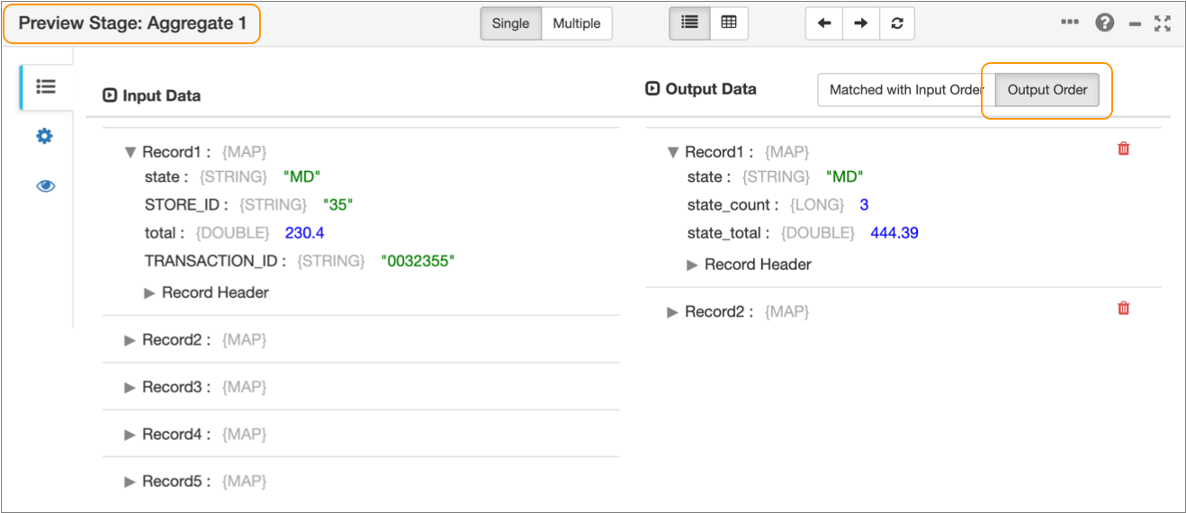
However, some processors such as the Aggregate or Profile processor don’t update records; they create new records. And other processors such as the Sort processor reorder the records. In these cases, comparing matching input and output records isn’t relevant. It's more helpful to display the output records in the order produced by the processor.
For example, when you preview data for an Aggregate processor, Transformer displays the output records in the output order by default. The Preview panel displays the input records under Input Data and the output records under Output Data without attempting to match the records, as follows:
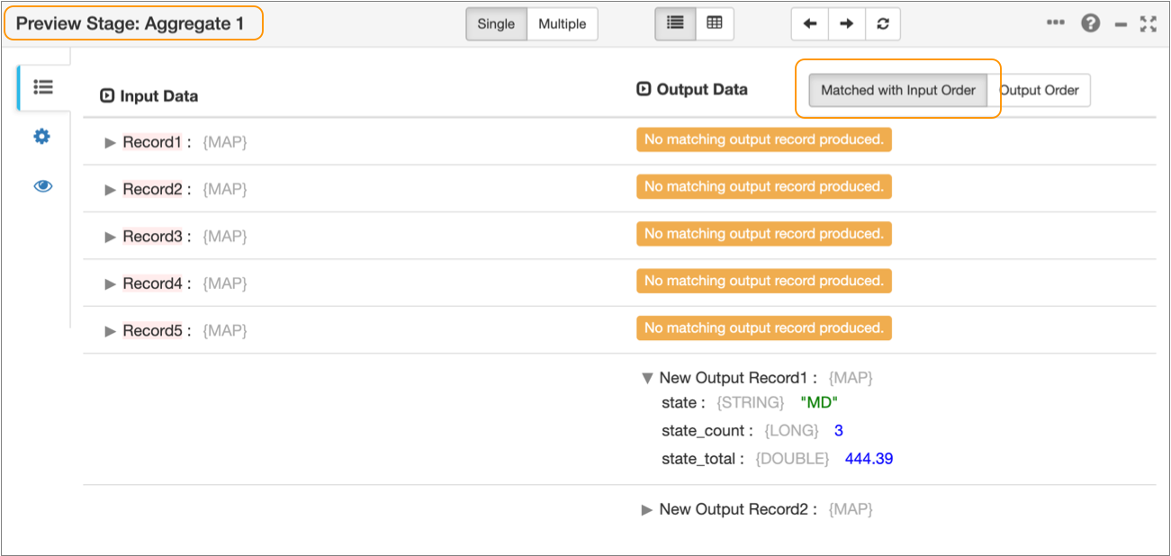
If you display the output records in matching order with the input records for the same Aggregate processor, Transformer attempts to match the input and output records. The Preview panel displays the input records first, noting under Output Data that no matching records exist. The Preview panel then displays the new output records created by the processor, as follows:
Input and Output Schema for Stages
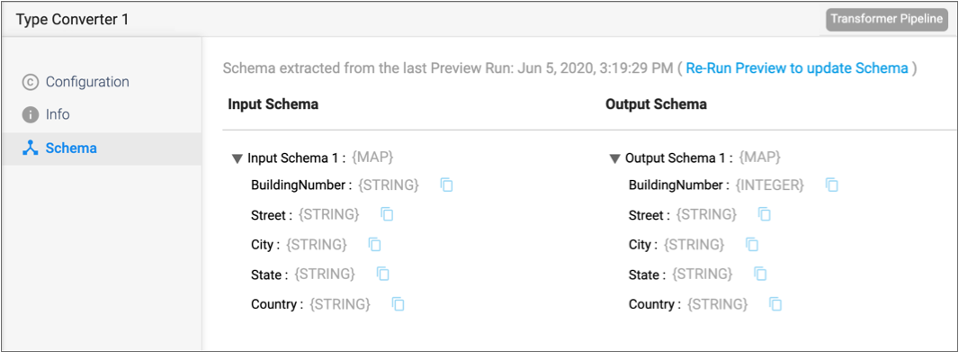
After running preview for a pipeline, you can view the input and output schema for each stage on the Schema tab in the pipeline properties panel. The schema includes each field path and data type.
Control Hub uses the schema extracted from the last data preview to list available field paths when you invoke expression completion for a stage property.
If you change the schema for a pipeline, for example if you remove a field, rename a field, or change the data type of a field, then you must run preview again so that the schema reflects the change.
In most cases as you configure stage properties, you can use expression completion to specify a field path. However, in some cases, you might use the Schema tab to copy a field path.
For example, let’s say you are configuring a Spark SQL Query processor and you need to
reference fields in the query. After running preview, you select the processor in the
pipeline canvas, and then click the Schema tab in the pipeline properties panel. You
click the Copy Field Path to Clipboard icon (![]() ) to
copy the field path from the Schema tab, and then paste the field path into the Spark
SQL query to run.
) to
copy the field path from the Schema tab, and then paste the field path into the Spark
SQL query to run.
The following image displays a sample Schema tab with the time of the last data preview:
Previewing a Pipeline
Preview a pipeline to review the values for each record to determine if the pipeline transforms data as expected. You can preview data for a single stage or for a group of linked stages.
-
In the toolbar above the pipeline canvas, click the
Preview icon:
 .
If the Preview icon is disabled, check the Validation Errors list for unconnected stages and required properties that are not defined.
.
If the Preview icon is disabled, check the Validation Errors list for unconnected stages and required properties that are not defined. -
In the Preview Configuration dialog box, configure the
following properties:
Preview Property Description Preview Using Spark to use for the preview: - Embedded Spark libraries - Previews all pipelines using the embedded Spark libraries included in the Transformer installation.
- Configured cluster manager - Previews cluster pipelines using the Spark cluster configured for the pipeline. Previews local pipelines using the local Spark installation on the Transformer machine.
Preview Batch Size Number of records to use in the preview. Honors values up to the maximum preview batch size defined in the Transformer configuration file. Default is 10. Default in the Transformer configuration file is 1,000.
Preview Timeout Milliseconds to wait for preview data. Use to limit the time that preview waits for data to arrive at the origin. Relevant for transient origins only. Run Preview Up to Stage Previews the pipeline up to the selected stage. Use to perform a partial preview when one of the stages encounters an error. For example, if preview fails because the Join processor encounters an error, run the preview up to the stage preceding the Join processor. Then you can view the preview data and correct the Join processor configuration as needed.
By default, previews all stages.
Time Zone Time zone used to display date, datetime, or time data. Default is the browser time zone.
Write to Destinations Determines whether the preview passes data to destinations. By default, does not pass data to destinations.
Show Record/Field Header Displays record header attributes and field attributes when in List view. Attributes do not display in Table view. Show Field Type Displays the data type for fields in List view. Field types do not display in Table view. Save Preview Record Schema Determines whether the preview record schema is saved in the pipeline configuration. By default, the schema is not saved. When you close and then reopen the pipeline, the Schema tab for each pipeline stage is empty. You must run preview again to update the input and output schema.
When selected, the schema is saved after the pipeline is closed. However, be aware that saving the schema can cause the pipeline configuration to reach an excessive size, which in turn can cause a publish or export of the pipeline to fail.
Remember the Configuration Stores the current preview configuration for use every time you request a preview for this pipeline. While running preview, you can change this option in the Preview panel by selecting the Preview Configuration tab and clearing the option. The change takes effect the next time you run preview.
-
Click Run Preview.
The Preview panel highlights the origin stage and displays preview data in list view. Since this is the origin of the pipeline, no input data displays.
To view preview data in table view, click the Table View icon:
 .
. - To delete a record that you do not want to use, click the Delete icon.
-
To view data for the next stage, select the stage in the pipeline canvas.
When you preview data for a processor, you can choose the order in which to display the output data.
-
To preview data for multiple stages, click
Multiple.
The preview canvas highlights the first stage and the last stage, displaying the input and output data for the selected group of stages.
- To change the first stage in the group, select the current first stage and then select the desired stage.
- To change the last stage in the group, select the current last stage and then select the desired stage.
-
To refresh the preview, Reload Preview.
Refreshing the preview provides a new set of data.
-
To exit preview, click the Close Preview icon:
 .
.
Editing Properties
When running preview, you can edit stage properties to see how the changes affect preview data. For example, you might edit the condition in a Stream Selector processor to see how the condition alters which records pass to the different output streams.
When you edit properties, you can test the change by refreshing the preview data.
-
To edit stage properties while running preview, select the stage you want to
edit and click the Stage Configuration icon:
 .
.
- Change properties as needed.
-
To test the changed properties, click Reload
Preview.
This refreshes the preview data.
- To revert your change, manually change the property back.