Working with Control Hub
Control Hub Draft Runs
A draft run is the execution of a draft pipeline. Use draft runs for development purposes only.
While editing a pipeline in the pipeline canvas, you can start a draft run to quickly test the pipeline logic. You can run a draft run as long as you'd like. This allows you to monitor the draft run over the course of hours or days, as needed, before you publish the pipeline for use in a production job.
For information about draft runs, see the Control Hub documentation.
Control Hub Jobs
- Create and run job instances from a published pipeline
- A job instance is the execution of a published pipeline. You can create a job instance from a published pipeline or from a job template.
- Create job templates
- A job template is a definition of a job that you can use to create and start multiple job instances. When you know that you want to create multiple job instances based on a single published pipeline, you can create a job template.
Monitoring Snowflake Jobs
You can monitor Snowflake jobs as you would any other Control Hub job. However, when the job completes, the Snowflake job summary displays different information from other Control Hub jobs.
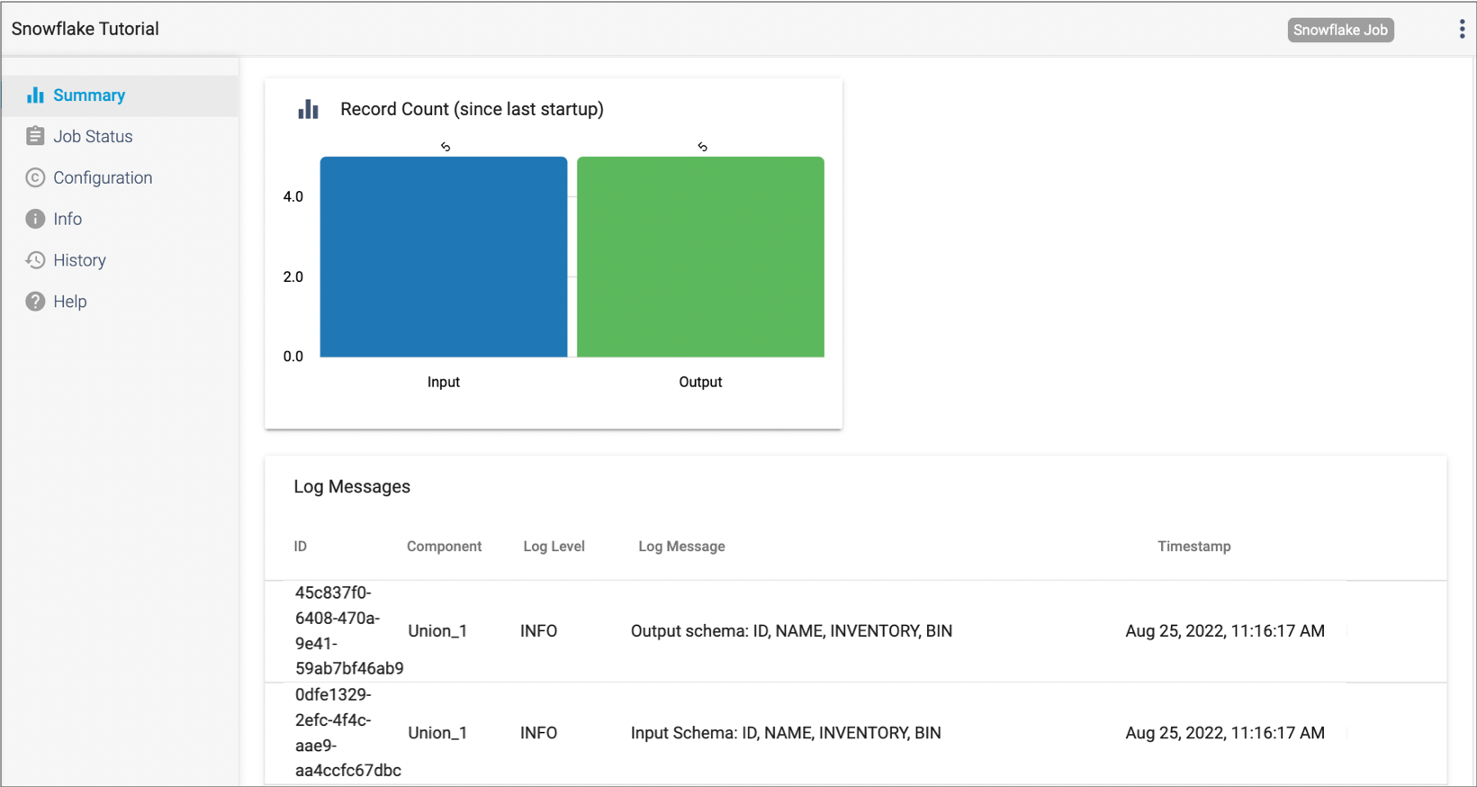
The summary for a completed Snowflake job displays the following information:
- Input and output row count
You cannot view an error row count, row throughput, or runtime statistics as you can for other Control Hub jobs.
- Log messages
Select the pipeline canvas to view all log messages for the pipeline. Select a stage to view log messages specific to that stage.
- Snowflake
queries
Select a destination in the pipeline canvas to view Snowflake queries generated for the job.
The following image displays the row count and log messages for a Snowflake job summary:
For information about monitoring Control Hub jobs, see the Control Hub documentation.
Snowflake Queries
The summary for a completed Snowflake job displays the Snowflake queries run for the job.
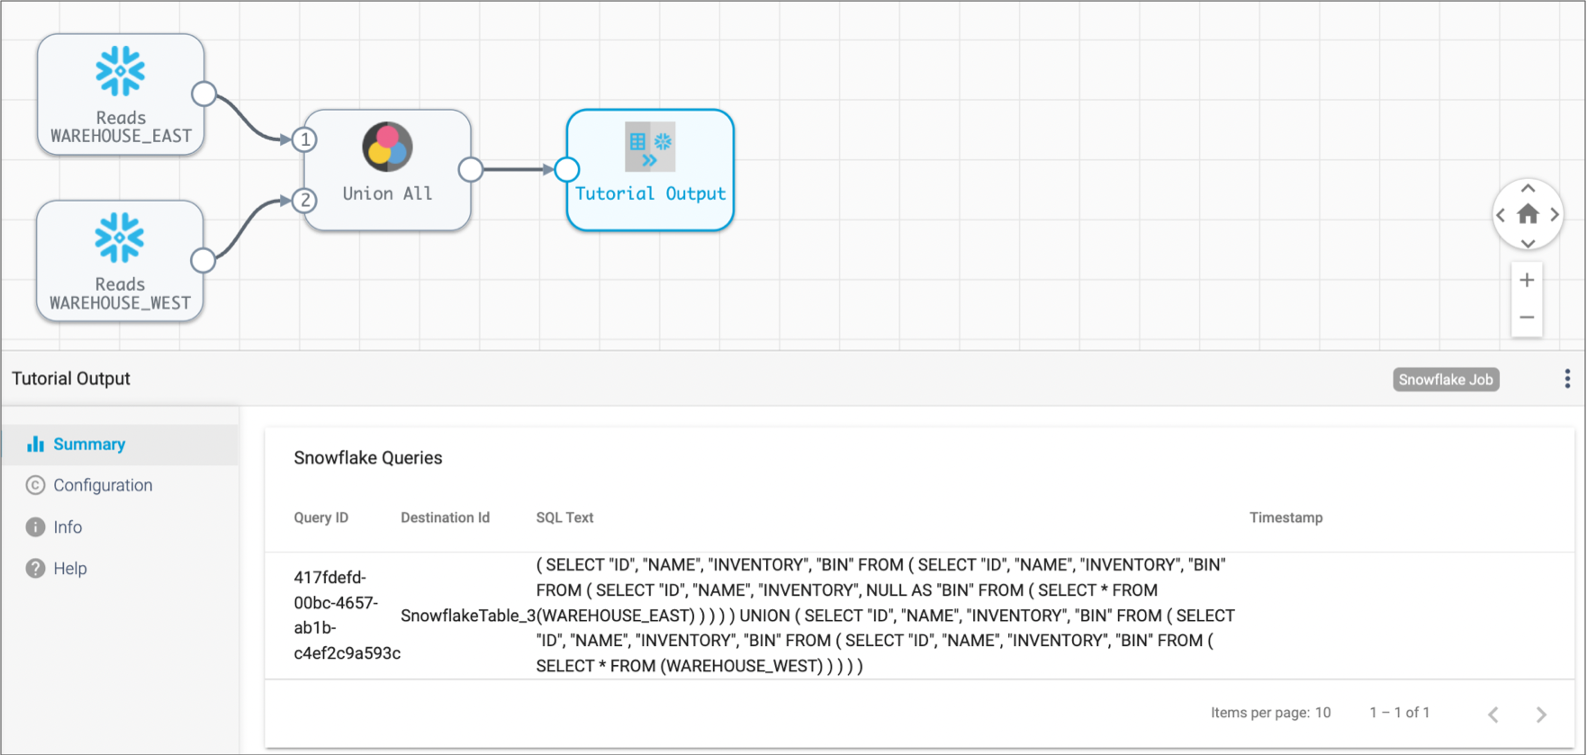
A Transformer for Snowflake job can generate a set of queries based on the complexity of your pipeline. The job generates unique queries for each destination and for each Snowflake SQL Query processor.
For example, if your pipeline contains three destinations, then the job generates at least three unique queries. If your pipeline contains the Snowflake SQL Query processor and a single destination, the job generates at least two unique queries as follows:
- Query generated from the origin to the Snowflake SQL Query processor.
- Query generated from the temporary Snowflake table created by the processor to the destination.
Select a destination in the pipeline canvas to view the Snowflake queries generated for that branch. For example, the following image displays the query generated for the selected destination:
https://<your instance name>.snowflakecomputing.com/console#/monitoring/queriesDisabling Data Preview
By default, you can preview Transformer for Snowflake pipelines. Data preview can be a useful tool for developing and testing Snowflake pipelines. However, it also involves displaying Snowflake data in the Control Hub user interface. For information about using data preview, see the Control Hub documentation.
When you work with Transformer for Snowflake, the only time that Snowflake data leaves Snowflake servers is when you preview data in a pipeline.
If your company policies or best practices prohibit data from leaving Snowflake servers, a user with the Organization Administrator role can disable data preview for your organization.
-
In the Navigation panel, click , and then click Advanced.
If the My Organization tab does not display in the navigation panel, you do not have the Organization Administrator role required to perform this task.
- To disable data preview, clear the Enable Snowpark Preview checkbox.
-
Click Save.
After this change, the Preview icon is disabled for all users the next time that they log in or refresh their browser.To enable preview again, select the Enable Snowpark Preview checkbox and click Save.