Pipeline Monitoring
Overview
When Transformer runs a pipeline, you can view real-time statistics about the pipeline.
- View real-time pipeline and stage statistics.
- Pause and then continue the monitoring.
- Use cluster or Spark URLs to access additional information.
- View the pipeline run history.
Pipeline and Stage Statistics
When you monitor a pipeline, you can view real-time summary statistics for the pipeline and for stages in the pipeline.
In monitor mode, the pipeline canvas displays a Running icon on the stages that are currently processing data. For example, the following image shows that both Orders and Store Details origins are currently processing data:

The Monitoring panel below the pipeline canvas displays statistics on the Summary tab. By default, the Monitoring panel displays pipeline statistics. Pipeline statistics include the record count for the pipeline, record and batch throughput, runtime statistics, and batch processing statistics. For a pipeline started with runtime parameters, pipeline statistics also display the parameter values that the pipeline is using.
Select a stage in the pipeline canvas to view statistics about the stage. Stage statistics include record and batch throughput and batch processing statistics.
The following image shows some of the pipeline statistics available on the Summary tab:

Pause Monitoring
When you view a running pipeline, the Monitoring panel updates the statistics on the Summary tab in real time. To analyze the current statistics, you can temporarily pause and then continue the monitoring.
To pause the monitoring of a running pipeline,
click the More icon (![]() ) in the toolbar and then click Pause
Monitoring. The pipeline continues to run, but the Monitoring panel
stops updating the statistics.
) in the toolbar and then click Pause
Monitoring. The pipeline continues to run, but the Monitoring panel
stops updating the statistics.
To continue the monitoring, click the More icon and then click Continue Monitoring.
Cluster and Spark URLs
In monitor mode, the Monitoring panel provides URLs for the cluster or the Spark application that runs the pipeline.
Use the URL to access additional information about the cluster or Spark application. For example, the Spark web UI can include information such as completed jobs, memory usage, running executors, and the Spark driver log.
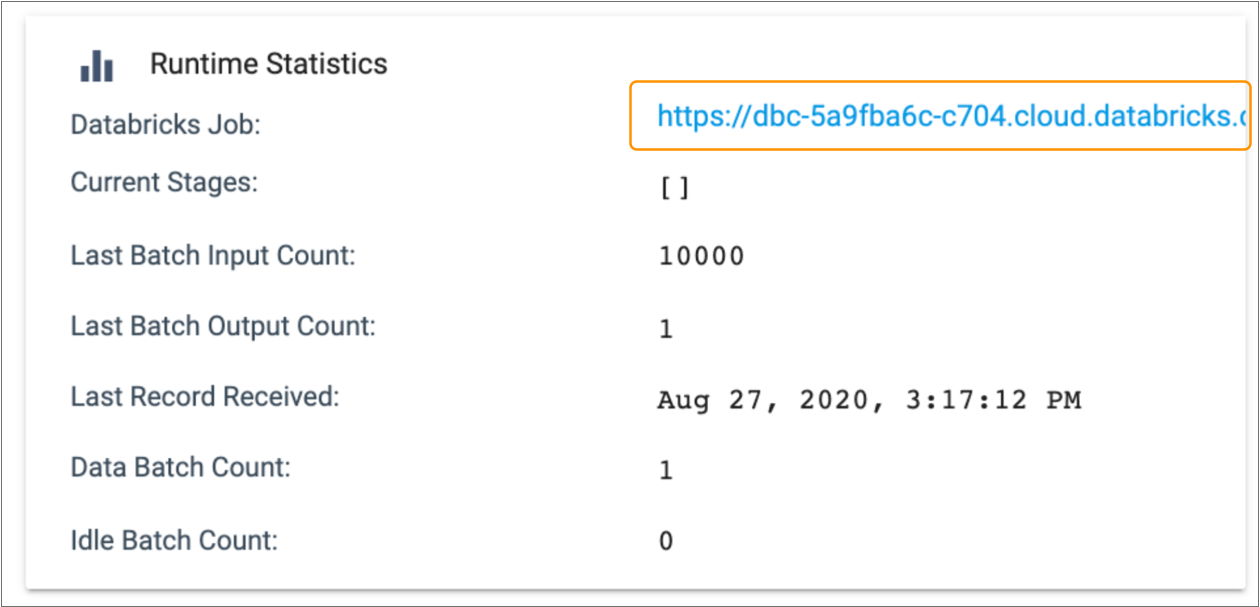
Cluster and Spark URLs display in the Runtime Statistics section of the Monitoring panel. For example, when you monitor a Databricks pipeline, the Databricks Job URL displays with the other runtime statistics, as follows:
| Cluster Manager Type | URL |
|---|---|
| Amazon EMR |
|
| Apache Spark for HD Insight |
|
| Databricks |
|
| Dataproc |
|
| Hadoop YARN |
|
| Spark Standalone |
|
| SQL Server 2019 Big Data Cluster |
|
Pipeline Run History
You can view the run history of a pipeline when you configure or monitor a pipeline. View the run history from either the Summary or History tab.
Summary Tab
To view pipeline run history from the Summary tab, select the pipeline run that you want to view from the list in the toolbar.
For example, the following image shows the Summary tab for the Revenue pipeline that has been run twice. To view the history of the run, you can select either pipeline run from the list in the toolbar:

When you view a previous run, the Summary tab displays a table of Spark application details at the top. The details can include the application ID and name, the start and completion time, the status of the run, and a link to the Spark driver log. The Summary tab also displays the most recent statistics captured for the pipeline.
Just as when you monitor a currently running pipeline, you can click the URL to access the Spark web UI. When you access the URL for a stopped pipeline, you’ll be taken to the Spark history server, as described in the Spark documentation.
History Tab
The History tab displays both the pipeline run history and the pipeline state history.
When you view the run history, the tab displays Spark application details for each pipeline run, including the application ID and name, the start and completion time, and the status of the run.
In the Summary column, click Metrics to view a summary of the completed run. The metrics summary includes the input and output count for the pipeline and for each stage. It also includes the pipeline stop and start time and the time that the last record was received.
Depending on the pipeline type, you can also click Driver Logs in the Summary column to view the Spark driver log.
The following image shows a sample run history:

- Each time that the pipeline status changed
- The changed pipeline status
- Related messages
- Parameter values used by the pipeline
- Access to each run summary
The following image shows a sample state history:
