Time Series Analysis
When time series analysis is enabled for a job, you can view historical time series data when you view the Summary tab in the Monitoring panel.
You can view time series data when the pipeline is configured to write statisticswrite statistics to Control Hub or to another system. The time series charts contain no data when the pipeline is configured to discard statistics.
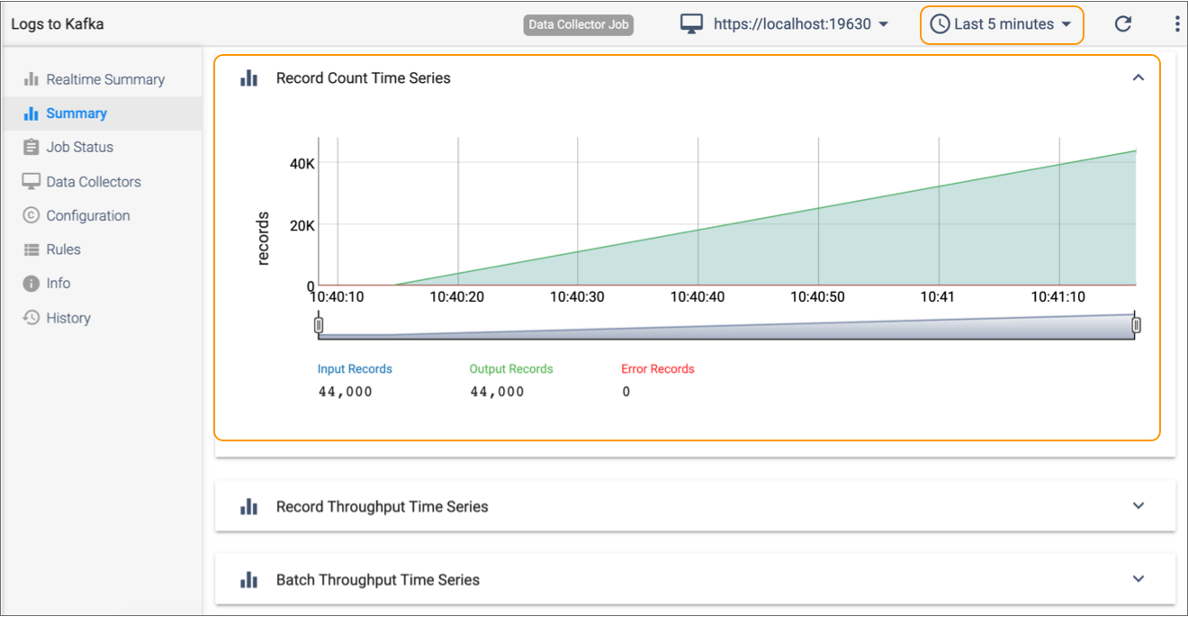
When time series analysis is enabled, you can generate data delivery reports, monitor topologies with data SLAs, view the record count for a specific time period and can analyze time series charts for the record count, record throughput, and batch throughput. For example, the following image displays the location where you can select a time period for analysis and displays the Record Count Time Series chart:

When time series analysis is disabled, you can still view the total record count and throughput for a job, but you cannot view the data over a period of time. For example, you can’t view the record count for the last five minutes or for the last hour. You also cannot view the time series charts for the job, generate a data delivery report, or monitor topologies with data SLAs.