To optimize pipeline performance and resource usage,
you can tune the number of threads and pipeline runners that a multithreaded pipeline
uses.
- threads
- Configure the maximum number of threads or concurrency in the origin.
- Before specifying a number of threads, consider how the origin uses threads.
All origins use threads to connect to the origin system and create batches
of data, but they can perform this task differently.
- For example, the JDBC Multitable Consumer origin uses one thread for each
table, so there's little point in configuring the origin to use more threads
than the number of tables being queried.
- In contrast, the HTTP Server origin listens at an HTTP endpoint. When you
configure the number of threads to use, you should consider the maximum
number of threads you might feasibly use in relationship to the peak spikes
and the number of available pipeline runners.
- Note that idle threads consume few resources, so little harm can come from
configuring extra.
- pipeline runners
- Configure the maximum number of pipeline runners using the Max Runners
pipeline property.
- Pipeline runners consume resources even when idle. So when considering the
number of runners to use, you should decide if you want to optimize for
performance, resource usage, or both.
- Pipeline runners process batches created by the origin threads. The speed of
processing might differ based on the complexity of the pipeline logic, batch
size, etc.
- So to determine the number of pipeline runners that you want to use, monitor
the number of available runners when you run the pipeline. If you find that
you have an abundance of available runners, you might reduce the number of
runners that you allow. Conversely, if the pipeline runners are generally
unavailable, increasing the number of pipeline runners can improve
performance.
For example, say you have a pipeline with the Kinesis Consumer reading from 4 shards. In
the origin, you set the number of threads to 4. You also leave the pipeline Max Runners
property with the default of 0, which creates a matching number of pipeline runners for
the threads - in this case, 4. After you start the pipeline and let it run for a while,
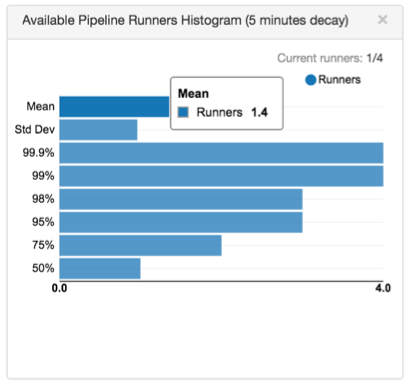
you check back and find the following histogram in the Data Collector UI:

The histogram shows that the mean is 1.4, which means at any time, it's likely that there
are 1.4 available runners.
If this is the peak load for the pipeline, this means you can reduce the number of
pipeline runners used in the pipeline to 3 without sacrificing much performance. If Data Collector
resources are needed elsewhere and you don't mind a minor hit to pipeline performance,
you might reduce the number of pipeline runners to 2.
